Loading...
Loading...
Loading...
Loading...
Loading...
Loading...
Loading...
Loading...
Loading...
Loading...
Loading...
We started this project with a simple assumption. Solving a maze is an easy task. If you enter a maze and place your hand on one wall of the maze and traverse the maze without ever removing your hand you’ll reach the exit. What happens though if the maze is… dynamic? How would you solve a maze that shifts and changes? The problem is itself intractable. There is no guaranteed way to solve such a maze, but fundamentally we believe that a brute force algorithm is a poor solution to the problem and with the possibility of cycles arising in such a maze; sometimes not a solution at all. We believe that in a dynamic maze it is possible to come up with a solution that given an infinite amount of time, can solve the maze by using knowledge about the structure of the maze as a whole.
This problem essentially is a simplification of a much more complicated problem in robotics: given a starting point and a known endpoint with an unknown location in an unknown environment, navigate from point A to point B with the added complication that the environment itself is not consistent. Think something comparable to a delivery robot being dropped off at an active construction site. There is no time to stop construction to allow the robot to scan and build a map of the site. There are going to be constantly moving vehicles and materials around the site. A worker tells the robot to go to the manager’s office and gives the robot some description to identify it. The robot must get from where it is to the office despite the scenario it is placed in. This is essentially the problem we are solving.
Problem: Develop an algorithm to autonomously navigate and solve a dynamically changing maze.
Explore the maze and build a representation of it as a graph data structure with intersections as nodes and distances between them as edges
Create a navigation system based on this graph representation to travel effectively around the maze, updating the graph as changes are detected in real-time. Essentially developing our own SLAM algorithm. (SLAM being an algorithm than automates navigation based on a known map)
A Helpful Resource for Overall Maze Methodology: https://www.pololu.com/file/0J195/line-maze-algorithm.pdf
Some Help With Tuning Your PID: https://www.crossco.com/resources/technical/how-to-tune-pid-loops/
Lidar Methodology: https://github.com/ssscassio/ros-wall-follower-2-wheeled-robot/blob/master/report/Wall-following-algorithm-for-reactive%20autonomous-mobile-robot-with-laser-scanner-sensor.pdf
Use: All that is needed to use the code is to clone the github repository and put your robot in a maze!
From a birds eye view, the solution we came up with to solve a dynamic maze mirrors a very interesting problem in graph algorithms. With the assumption that the key to our solution lies in building an understanding of the structure of the maze as a whole, we build a map on the fly as we traverse the maze. We represent the maze as a graph data structure, labeling each intersection in the maze we reach as a node and each edge as the distance between these intersections in the maze. We create these nodes and edges as we encounter them in our exploration and delete nodes and edges as we come across changes in the maze. This problem can then be seen in actuality as a graph algorithms problem. Essentially we are running a graph search for a node with an unknown entry point into an unknown graph that itself is unreliable or rather, “live” and subject to modification as it is read. There are then 2 stages to solving this problem. The first is learning the graph for what it is as we explore, or rather create a full picture of the graph. Once we have explored everything and have not found the exit we know searching for the exit is now the problem of searching for change. The crux of solving this problem is characterizing the changes themselves. It is by understanding how changes take place that we devise our graph search from here to find these changes. For example, a graph whose changes occur randomly with equal probability of change at each node would have an efficient search solution of identifying the shortest non cyclical path that covers the most amount of nodes. The change behavior we used for our problem was that changes happen at certain nodes repeatedly. To solve the maze, we then use the previous solution of searching the most nodes as quickly as possible for changes if we fully explore the maze without identifying anything, then once a changing node is found we label it as such so we can check it again later, repeating these checks until new routes in the maze open up.
As a note, some simplifications that we use for time’s sake: Width of corridors in the maze are fixed to .5m Turns with always be at right angles
We designed an intelligent maze-solving robot navigation system that employs a depth-first search (DFS) algorithm for effective graph traversal. Our solution is structured into two primary components: laserutils and pid_explore, which work together seamlessly to facilitate the robot's navigation and exploration within the maze.
The laserutils module is a collection of essential utility functions for processing laser scan data and assisting in navigation. It calculates direction averages, simplifies 90-degree vision frameworks, detects intersections, and implements a PID controller to maintain a straight path. Moreover, it incorporates functions for converting yaw values, managing node formatting, and handling graph data structures, ensuring a streamlined approach to processing and decision-making.
The pid_explore module serves as the core of the robot's navigation system. It subscribes to laser scan and odometry data and employs the laserutils functions for efficient data processing and informed decision-making. The robot operates in three well-defined states: "explore," "intersection," and "position," each contributing to a smooth and strategic navigation experience.
In the "explore" state, the robot uses the PID controller to navigate straight, unless it encounters an intersection, prompting a transition to the "intersection" state. Here, the robot intelligently labels the intersection, assesses the path's continuation, and determines its next move. If the robot is required to turn, it shifts to the "position" state, where it identifies the turn direction (left or right) and completes the maneuver before resuming its straight path.
Our navigation system employs a Graph class to store and manage the maze's structure, leveraging the power of the DFS algorithm to find the optimal path through the maze. The result is a sophisticated and efficient maze-solving robot that strategically navigates its environment, avoiding any semblance of brute force in its problem-solving approach.
We built this project to address the challenges faced by robots in navigating unpredictable and dynamic environments, such as active construction sites or disaster zones. Traditional maze-solving algorithms, based on brute force and heuristics, are inadequate in such situations due to the constantly changing nature of the environment.
Our goal was to develop an intelligent navigation system that could adapt to these changes in real-time and continue to find optimal paths despite the uncertainties. By creating a program that can autonomously drive a robot through a changing maze, we aimed to advance robotic navigation capabilities and make it more efficient and useful in a wide range of applications.
With our innovative approach of "on the fly" map creation and navigation, we sought to enable robots to traverse dynamic spaces with minimal prior knowledge, making them more versatile and valuable in industries that require real-time adaptability. By simultaneously building and updating the map as the robot navigates, we ensured that the robot could rely on its current understanding of the environment to make informed decisions.
Ultimately, we built this project to push the boundaries of robotic navigation, opening up new possibilities for robots to operate in complex, ever-changing environments, and offering solutions to a variety of real-world challenges.
The project began our first week with a theoretical hashing out of how to approach the problem and what simplifications to make. We started by learning how to build simulations in Gazebo and implementing our Lidar methods. We then were able to create simple demos of an initial explore algorithm we created with the “explore”, “intersection”, “position” approach. Gazebo issues were encountered early on and were largely persistent throughout the course of the project with walls losing their physics upon world resets. At this point we built larger models in Gazebo to test with and implemented a PID algorithm to smooth the robot’s traversal. This PID would go through several versions as the project went on especially as we tuned navigation to be more precise as we adjusted our hall width from 1 meter down to .5. We then formulated and integrated our graph data structure and implemented a DFS algorithm to automatically find paths from node to node to navigate. We then added node labeling and cycle detection to our graph to recognize previously visited nodes. One of our group member’s github became permanently disconnected from our dev environment in the last stage of the process but all challenges are meant to be overcome. We finished by accounting for dynamic change in our algorithm and designed a demo.
Despite having trouble in our Gazebo simulations we were surprised to see that our algorithm worked well when we moved our tests over to the physical robots. PID especially, which had proven to be trouble in our testing in fact worked better in the real world than in simulations. There were a few corners cut in robustness (ie: with the simplifications agreed upon such as only right angle turns), but overall the final product is very adaptable within these constraints and accounts for a number of edge cases. Some of the potential improvements we would have liked to make is to expand past these simplifications of only having right-angled intersections and limited hall width. The prior would greatly change the way we would have to detect and encode intersections for the graph. A next algorithmic step could be having two robots traverse the maze from different points at the same time and sharing information between each other. This would be the equivalent of running two concurrent pointers in the graph algorithm. Overall, though an initially simple project on the surface, we believe that the significance of this problem as a graph algorithms problem not only makes it an important subject in robotics (maze traversal) but also an unexplored problem in the larger world of computer science; searching an unreliable/live modifying graph.
Naimul Hasan (naimulhasan@brandeis.edu | ) Jimmy Kong (jameskong@brandeis.edu | ) Brandon J. Lacy (blacy@brandeis.edu | )
May 5, 2023
“You can’t be an expert in everything. Nobody’s brain is big enough.” A quote that’s been stated by Pito at least twice this semester and once last semester in his software entrepreneurship course, but one that hadn’t truly sunk in until the time in which I, Brandon, sat down to write this report with my teammates, Naimul and Jimmy.
I’ve greatly enjoyed the time spent on group projects within my professional experiences, but always erred on the side of caution with group work in college as there’s a much higher chance an individual won’t pull their weight. It’s that fear of lackluster performance from the other team members that has always driven me to want to work independently. I’d always ask myself, “What is there to lose when you work alone?
You’ll grow your technical expertise horizontally and vertically in route to bolster your resume to land that job you’ve always wanted, nevermind the removal of all of those headaches that come from the incorporation of others. There is nothing to lose, right?”
Wrong.
You lose out on the possibility that the individuals you could’ve partnered with are good people, with strong technical skills that would’ve made your life a whole lot easier throughout the semester through the separation of duties. You lose out on a lot of laughs and the opportunity to make new friends.
Most importantly, however, you lose out on the chance of being partnered with individuals who are experts in areas which are completely foreign to you.There is nobody to counter your weaknesses. You can’t be an expert in everything, but you can most certainly take the gamble to partner with individuals to collectively form one big brain full of expertise to accomplish a project of the magnitude in which we’ve accomplished this semester.
I know my brain certainly wasn’t big enough to accomplish this project on my own. I’m grateful these two men reached out to me with interest in this project. Collectively, we’ve set the foundation for future iterations of the development of campus rover and we think that’s pretty special considering the long term impact beyond the scope of this course. So, I guess Pito was right after all; one brain certainly isn’t big enough to carry a project, but multiple brains that each contribute different areas of expertise. Now that’s a recipe for success.
The command and control dashboard, otherwise known as the campus rover dashboard, is a critical component to the development of the campus rover project at Brandeis University as it’s the medium in which remote control will take place between the operator and the robot. It is the culmination of three components: a web client, robot, and GPS. Each component is a separate entity within the system which leverages the inter-process communications model of ROS to effectively transmit data in messages through various nodes. There are various directions in which the campus rover project can progress, whether it be a tour guide for prospective students or a package delivery service amongst faculty. The intention of our team was to allow the command and control dashboard to serve as the foundation for future development regardless of the direction enacted upon in the future.
The front-end and back-end of our web client is built with React.js. The app.js file is used to manage routes and some React-Bootstrap for the creation of certain components, such as buttons. The code structure is as follows: app.js contains the header, body, and footer components. The header component hosts the web client’s top-most part of the dashboard which includes the name of the application with links to the different pages. The footer component hosts the web-client’s bottom-most part of the dashboard which includes the name of each team member. The body component is the meat of the application which contains the routes that direct the users to the various pages. These routes are as follows: about, help, home, and settings. Each of these pages utilize components that are created and housed within the rosbridge folder. You can think of them as parts of the page such as the joystick or the video feed. The ros_congig file serves as the location for default values for the settings configurations. We use local storage to save these settings values and prioritize them over the default values if they exist.
and
ROSBridge is a package for the Robot Operating System (ROS) that provides a JSON-based interface for interacting with ROS through WebSocket protocol (usually through TCP). It allows external applications to communicate with ROS over the web without using the native ROS communication protocol, making it easier to create web-based interfaces for ROS-based robots. ROSLIBJS is a JavaScript library that enables web applications to communicate with ROSBridge, providing a simple API for interacting with ROS. It allows developers to write web applications that can send and receive messages, subscribe to topics, and call ROS services over websockets. ROSBridge acts as a bridge between the web application and the ROS system. It listens for incoming WebSocket connections and translates JSON messages to ROS messages, and the other way around. ROSLIBJS, on the other hand, provides an API for web applications to interact with ROSBridge, making it easy to send and receive ROS messages, subscribe to topics, and call services. In a typical application utilizing ROSBridge and ROSLIBJS, it would have the following flow:
Web client uses ROSLIBJS to establish a WebSocket connection to the ROSBridge server, through specifying a specific IP address and port number.
The web client sends JSON messages to ROSBridge, which converts them to ROS messages and forwards them to the appropriate ROS nodes.
If the node has a reply, the ROS nodes send messages back to ROSBridge, which converts them to JSON and sends them over the WebSocket connection to the web client.
GPS, or Global Positioning System, is a widely-used technology that enables precise location tracking and navigation anywhere in the world through trilateration, a process which determines the receiver’s position by measuring the distance between it and several satellites. Though it has revolutionized the way we navigate and track objects, its accuracy can vary depending on a variety of factors that are beyond the scope of this paper. However, there are various companies which have embraced the challenge of a more accurate navigation system that incorporates other data points into the algorithm responsible for the determination of the receiver position. Apple is notorious for the pin-point accuracy available within their devices which incorporate other sources such as nearby Wi-Fi networks and cell towers to improve its accuracy and speed up location fixes. The utilization of a more sophisticated location technology is critical for this project to be able to navigate routes within our university campus. Therefore, we’ve chosen to leverage an iPhone 11 Pro placed on our robot with the iOS application GPS2IP open to leverage the technology available in Apple’s devices to track our robot’s movement.
GPS2IP is an iOS application that transforms an iPhone or iPad into a wireless GPS transmitter over the network. It possesses various features such as high configurability, background operation on the iPhone, and standard NMEA message protocols. There is a free lite version available for testing and system verification as well as a paid version with all available features.
Nodes
/gps
The node’s purpose is to listen to GPS2IP through a socket and publish the data as a gps topic. The GPS2IP iOS application provides the functionality of a portable, highly sophisticated, GPS receiver that provides a very accurate location when the iPhone is placed on the robot. The GPS data is sent as a GLL NMEA message from a given IP address and corresponding port number. The /gps node leverages the socked package in Python to listen to the messages published at that previously emphasized IP address and port number. Through this connection, a stream of GLL messages can be received, parsed, and transformed into the correct format to be interpreted by the web client. The main transformation is for the latitude and longitude from decimal and minutes to decimal degrees format. The node will publish continuously until the connection through the socket is disturbed. The topic has a data type of type String, which is a serialized version of JSON through the utilization of the json package to dump the Python dictionary.
Code
img_res
The node’s purpose is to alter the quality of the image through a change in resolution. It’s done through the utilization of the OpenCV package, CV2, and cv_bridge in Python. The cv_bridge package, which contains the CvBridge() object, allows for seamless conversion from a ROS CompressedImage to a CV2 image and vice versa. There are two different camera topics that can be subscribed to depending upon the hardware configuration, /camera/rgb/image/compressed or /raspicam_node/image/compressed. Additionally, the /image_configs topic is subscribed to to receive the specifications for the resolution from the web client. A new camera topic is published with the altered image under the topic name /camera/rgb/image_res/compressed or /raspicam_node/image_res/compressed depending upon the hardware configuration. The web client subscribes to this topic for the camera feed.
Code
/rostopiclist
The node’s purpose is to retrieve the output generated by the terminal command “rostopic list” to receive a list of currently published topics. It performs this functionality through the use of the subprocess package in Python, which will create a new terminal to execute the command. The output is then cleaned to be published over the topic “/rostopic_list”. The topic has a data type of type String. It is subscribed too by the web client and parse the data based upon the comma delimiter. The content is used to create a scrollable menu that displays all of the available rostopics.
Code
Architecture
The command-control repository can be effectively broken down into six branches, with one deprecated branch, to create a total of five active branches:
main: The branch contains the stable version of the project. It is locked, which means no one can directly push to this branch without another person reviewing and testing the changes.
ros-api: The branch was initially committed to develop an API through FastAPI, but was later deprecated because the functionality could be implemented with ROSBridge and ROSLIBJS.
ros-robot: The branch focuses on the development and integration of the Robot Operating System (ROS) with a physical or simulated robot. It includes the launch files responsible for the run of the gps, dynamic image compression, and ROSBridge.
test-old-videofeed: The branch was created to test and debug the previous implementation of the dashboard, which was built five years ago. We imported the video from the old dashboard to our dashboard but later deprecated this implementation as it used additional redundant dependencies which can be implemented with ROSBridge and ROSLIBJS.
test-old-web-client: The branch is to test and understand the previous version of the web client dashboard. It helped us realize areas for improvement, such as a way to set the robot’s IP address within the web application. It also set the tone for our simplified dashboard format.
web-client: The branch is for ongoing development of the new web client. It includes the latest features, improvements, and bug fixes for the web client, which may eventually be merged into the main branch after thorough testing and review.
Contribution Policy
In this section it will guide you through the process of contributing to a GitHub repository following the guidelines outlined in the contributing.md file. This file specifies that the main branch is locked and cannot be directly pushed to, ensuring that changes are reviewed before being merged.
Update the Main Branch
Ensure you are on the main branch and pull down the new changes.
Installation and Run
Clone the GitHub repository which contains the web client code.
Install the necessary dependencies by running ```npm install``` in the terminal.
Start the web client by running ```npm start``` in the terminal.
Web Client Settings
The IP address of the ROSBridge server. It is the server that connects the web application to the ROS environment.
Port: The port number for the ROSBridge server.
Video Resolution Width: The width of the video resolution for the ROS camera feed.
Run with ROS Robot
SSH into the robot.
Open the GPS2IP iOS application. In the application settings, under “NMEA Messages to Send”, solely toggle “GLL”. Once set, toggle the “Enable GPS2IP” on the homepage of the application. Additionally, turn off the iOS auto-lock to prevent the application connection from being interrupted. Place the device on the robot.
Launch the necessary ROS launch file to run the vital nodes which include gps, img_res, and rostopiclist. You may use the sim.launch file for a simulation in Gazebo and real.launch for real world.
I, Brandon, had initially intended to work on this project independently but was later reached out to by Naimul and Jimmy to form the team as presently constructed. The project was initially framed as a simple remote teleoperation application in which a user could control the robot with an arrow pad. However, it has evolved into a more sophisticated product with the expertise added from my fellow teammates. The project is now boasted as a dashboard that leverages a joystick for a more intuitive control mechanism with a live camera feed and GPS localization which far exceeded the initial outline as a result of the additional requirements associated with a group of three individuals in a team. Pito proposed various ideas associated with campus rover and it was on our own accord that we chose to combine the dashboard with the GPS localization to create a strong command center for a user to control a robot of choice.
The team was constructed based upon a single common interest, participation within a final project that challenged our software engineering skills within a new domain that would have a long-term impact beyond this semester. It was coincidental that our individual areas of expertise balanced out our weaknesses. The team was balanced and all members were extremely active participants throughout weekly stand ups, discussions, and lab work.
Separation of Duties
Naimul Hasan
Throughout the semester, my responsibilities evolved according to the team's requirements. Initially, after Jimmy provided a visual representation of the previous dashboard, I designed an intuitive and user-friendly Figma layout. I then examined the code and relevant research, which led me to employ ROSLIBJS and RosBridge for the project. I dedicated a week to establishing a workflow standard for the team, including locking down the main branch and authoring a CONTRIBUTING.md document to ensure everyone understood and followed the desired workflow. After gaining an understanding of websocket communication between ROSLIBJS and ROSBridge, I focused on developing the Home page, which now features a video feed, map, and teleop joystick component. To address the issue of multiple websocket connections for each component, I transitioned to using a React Class Component with a global ROS variable. This enabled the components to subscribe and publish messages seamlessly. Additionally, I modified one of the ROSLIBJS dependencies to prevent app crashes and created a default settings configuration for simulation mode, which Jimmy later integrated with localStorage. The initial configuration consumed a significant portion of time, followed by the development of the map component. After exploring various options, such as react-leaflet and Google Maps, I chose Mapbox due to its large community and free API for GPS coordinates. Simultaneously, James and I resolved a dashboard crash issue stemming from localStorage data being empty and causing conversion errors. Collaborating with Brandon, I worked on integrating GPS data into the dashboard. We encountered a problem where the frontend couldn't correctly read the message sent as a string. After a week, we devised a solution in the Python code, converting the GPS data from Decimal Degrees and Minutes (DDM) to Decimal Degrees (DD). This adjustment enabled us to track movements on the map accurately. Additionally, I was responsible for deploying the app, initially attempting deployment to Netlify and Heroku. After evaluating these options, I ultimately settled on Azure, which provided the most suitable platform for our project requirements.
It is worth noting that regardless of whether the app is deployed locally, within the Kubernetes cluster on campus, or on Azure, the primary requirement for successful communication between the laptop/client and the robot is that they are both connected to the same network, since dashboard relies on websocket communication to exchange data and control messages with the robot, which is facilitated by the ROSLIBJS and ROSBridge components. Websocket connections can be established over the same local network, allowing for seamless interaction between the robot and the dashboard.
Jimmy Kong
During the beginning of the semester, my work started out as researching the old web client to see if we could salvage features. I was able to get the old web client working which helped us research and analyze the ways in which rosbridge worked and how we would have our web client connect to it as well. After we got a good foundational understanding from the web client, I started working on a settings page which would provide the user with a more convenient and customizable experience. The settings page went through multiple iterations before it became what it is today, as it started out very simple. The following weeks I would work on adding additional components such as the dropdown menu that shows the list of ros topics, the dropdown menu that shows the current settings configuration, the manual input teleoperation form that allows the user to manually input numbers instead of using the joystick, the robot battery status indicator that shows the battery status of the robot, clear button to clear the input boxes, reset to default button to clear locally stored values, placeholder component that displays a video error message, and last but not least dark mode for theming the website and for jokes since we basically wrapped up the project with a few days to spare. For the dropdown menu that shows the list of ros topics, I also had to create a python node that would send the “rostopic list” command and then use that output to then publish as a string separated by commas as a row topic. I would then subscribe to that topic and parse it via commas on the web client side for the rostopiclist button. After adding all these components, I also had to add the corresponding buttons (if applicable like dark mode or battery status) to the settings page to give the user the option to disable these features if they did not wish to use them. Inserting forms and buttons into the settings page made us have to think of a way to save the settings configurations somehow to survive new browser sessions, refreshes, and the switching of pages. To solve this issue, I utilized localStorage which worked great. I wrote logic for deciding when to use localStorage and when to use default values stored in our ros_configs file. After finishing the implementation of local storage, I also decided to add some form validation along with some quality of life error indicator and alert messages to show the user that they are putting in either correct or incorrect input. Aside from focusing on the settings page, I also handled the overall theming and color scheme of the website, and made various tweaks in CSS to make the website look more presentable and less of a prototype product. I also modified the about page to look a bit better and created a new help page to include instructions for running the web client. In summary, I was responsible for creating multiple components for the web client and creating the appropriate setting configuration options within the settings page, working on the aesthetics of the website, and creating the help page. Lastly, I also edited the demo video.
Brandon J. Lacy
The contribution to this project on my behalf can be broken down into two different phases: team management and technical implementation. I was responsible for the project idea itself and the formation of the team members. I delegated the duties of the project amongst the team members and led the discussions within our weekly discussions outside of the classroom. I also set the deadlines for our team to stay on track throughout the semester. The technical contribution revolves around the GPS implementation in which I selected the GPS receiver, an iPhone with the GPS2IP iOS application. I was responsible for the Python code to receive the data from the GPS receiver over the internet. Lastly, I was responsible for the node that changes the resolution of the image that is displayed on the web client.Lastly, I wrote 75% of the report and the entire poster.
Major Hurdles
Initially, the dashboard was hosted on Naimul's laptop for testing purposes, which allowed the team to evaluate its functionality and performance in a controlled environment. When we tried to deploy the dashboard on Netlify, we encountered several issues that hindered the deployment process and the app's performance.
One of the primary issues with Netlify was its inability to run a specific version of Node.js, as we want to avoid version mismatch, required by the dashboard. This limitation made it difficult to build the app using Netlify's default build process, forcing the us to manually build the app instead. However, even after successfully building the dashboard manually, the we faced additional problems with the deployment on Netlify. The app would not load the map component and other pages as expected, which significantly impacted the app's overall functionality and user experience.
As we were trying to find a new platform to host the dashboard so it can run 24/7 and pull down any changes from the main branch. Azure allowed us to download specific version of dependencies for the dashboard, while leaving overhead in resource availability if there is a lot of traffic. As mentioned above, regardless of whether the app is deployed locally, within the Kubernetes cluster on campus, or on Azure, the primary requirement for successful communication between the laptop/client and the robot is that they are both connected to the same network, since dashboard relies on websocket communication to exchange data and control messages with the robot, which is managed by the ROSLIBJS and ROSBridge components. Websocket connections can be established over the same local network, allowing for seamless interaction between the robot and the dashboard.
Major Milestones
Public Web Client hosting
Hosting the web client publically so that anyone can access the website with a link was a major milestone that we reached since just hosting through local host was not practical since its just for development usage and would not be very useful. More is explained within the major hurdle discussed above.
GPS
The implementation of the GPS was a major milestone in our project as it was the most difficult to design. When the project was initialized, there was no intention to incorporate GPS into the dashboard. However, the requirements for the project were increased when the team expanded to three people. The GPS portion of the project was dreaded, quite frankly, so when the Python code was completed for a ROS node that listened to the GPS data being published from the GPS2IP iOS application it was a huge celebration. The kicker was when the topic was subscribed to on the front-end and the visualization on the map was perfectly accurate and moved seamlessly with our movement across campus.
Dark Mode
Dark mode, a seemingly small feature, turned out to be a monumental milestone in our project. Its implementation was far from smooth sailing, and it presented us with unexpected challenges along the way. Little did we know that this seemingly simple concept would revolutionize the entire user experience and become the most crucial component of our project. Initially, we underestimated the complexity of integrating dark mode into our dashboard. We had to navigate through a labyrinth of CSS styles, meticulously tweaking each element to ensure a seamless transition between light and dark themes. Countless hours were spent fine-tuning color schemes, adjusting contrasts, and experimenting with different shades to achieve the perfect balance between aesthetics and readability. The moment dark mode finally came to life, everything changed. It was as if a veil had been lifted, revealing a whole new dimension to our dashboard. The sleek, modern interface exuded an air of sophistication, captivating users and immersing them in a visually stunning environment. It breathed life into every element, enhancing the overall user experience. It quickly became apparent that dark mode was not just another feature; it was the heart and soul of our project. The dashboard transformed into an oasis of productivity and creativity, with users effortlessly gliding through its streamlined interface. Tasks that were once daunting became enjoyable, and the project as a whole gained a newfound momentum. In fact, we can boldly assert that without dark mode, our dashboard would be practically unusable. The blinding glare of the bright background would render the text illegible, and the stark contrast would induce eye strain within minutes. Users would be left squinting and frantically searching for a pair of sunglasses, rendering our carefully crafted functionalities utterly useless. Dark mode's significance cannot be overstated. It has redefined the essence of our project, elevating it to new heights. As we reflect on the struggles, the countless lines of code, and the sleepless nights spent perfecting this feature, we cannot help but celebrate the impact it has had. Dark mode, the unsung hero of our project, has left an indelible mark on our journey, forever changing the way we perceive and interact with our dashboard.
We sought a deeper understanding of the inter-process communications model of ROS to be able to allow our web application to take advantage of this model and we’ve successfully developed this knowledge. Additionally, it allowed us to integrate our software development knowledge with ROS to create a complex system which will draw attention to our respective resumes. We are proud of the product created in this course and see it as a major improvement from the previous implementation of the dashboard. The only aspect in which we are not content is the lag present on the camera feed and joystick. However, there are areas for improvement in which we recommend to be addressed by the next team to tackle this project. The lag issue previously described is one of them as it decreases usability of the product. It would also be useful to create a map of the campus with way points in which the GPS can be utilized to create a path from one place to another. There are a variety of improvements to be made to this application to continue to shape campus rover into an implemented product. It’s up to the next generation of students to decide where to take it next.
Efficiently search our graph for the exit to the maze its dynamic property making the graph unreliable
Entity Used for Consulting: https://chat.openai.com
laserUtils.py
Process Lidar Data
pid_explore.py
Navigating Maze
ROSLIBJS API processes the incoming JSON messages so it can be displayed/utilized to the web client
Resolve any conflicts which may arise at this time.
Create a New Branch
Create a new branch for the feature or issue and switch to it.
Verify the current branch is the correct branch before you begin work.
Build Feature
Develop the feature or fix the issue on the new branch.
Check for Conflicts within the Main Branch
Ensure there are no conflicts with the main branch prior to the creation of the pull request. Update the main branch and merge the changes into your feature branch.
Create a Pull Request (PR)
Push the changes to the remote repository and create a pull request on GitHub. Provide a clear and concise description of the purpose of the feature as well as how to test it. Ensure you mention any related issue numbers.
Request a Review
Ask another team member to review your pull request and run the code locally to ensure there are no errors or conflicts.
Merge the Branch
Once the review is complete and the changes are approved, the feature branch can be merged into the main branch through the pull request.
Navigate to the settings page on the web client to set them according to your intentions.
Video Resolution Height: The height of the video resolution for the ROS camera feed.
Video Frame Width: The width of the video frame for the ROS camera feed.
Video Frame Height: The height of the video frame for the ROS camera feed.
Show Battery Status: A toggle to display the battery status in the web application.
Manual Input Teleoperation: A toggle to enable or disable the manual teleoperation control input to replace the joystick.
Run any other nodes that you desire.
Ensure the web client has the correct ROSBridge Server IP Address and Port set within the settings page. You can check this with the “current configurations” button.
If you want the camera to show up, make sure that the correct campera topic is set within the img_res node module. It can vary dependent upon the hardware. The two options are listed within the file with one commented out and the other active. Select one and comment out the other.
Enjoy the web client!


Team Members: Michael Jiang (michaeljiang@brandeis.edu) & Matthew Merovitz (mmerovitz@brandeis.edu)
The project aimed to create a robot that could mimic the game of bowling by grabbing and rolling a ball towards a set of pins. The robot was built using a Platform bot with a pincer attachment. The ball is a lacrosse ball and the “pins” are either empty coffee cups or empty soda cans.
At first, we imagined that in order to achieve this task, we would need to create an alley out of blocks, map the space, and use RGB for ball detection. None of this ended up being how we ultimately decided to implement the project. Instead, we opted to use fiducial detection along with line following to implement ball pickup and bowling motion. The fiducial helps a lot with consistency and the line following allows the robot to be on track.
The primary objective of the BowlingBot project was to develop a robot that could perform the task of bowling, including locating the ball, grabbing it, traveling to the bowling alley, and knocking down the pins with the ball. The project aimed to use a claw attachment on the Platform bot to grab and roll the ball towards the pins. The robot was designed to use fiducial markers for ball detection and orientation, and line detection for pin alignment.
The BowlingBot project utilized several algorithms to achieve its objectives. These included:
Fiducial Detection: The robot was designed to use fiducial markers to detect the location and orientation of the ball. The fiducial markers used were ArUco markers, which are widely used in robotics for marker-based detection and localization. In addition, we used odometry to ensure precision, allowing us to consistently pick up the ball.
Line Detection: The robot utilized line detection techniques to align itself with the pins. This involved using a camera mounted on the robot to detect the yellow line on the bowling alley and align itself accordingly. This also uses OpenCV.
Pincer Attachment: The BowlingBot utilized a pincer attachment to pick up the ball and roll it towards the pins.
The code is centered around a logic node that controls the logic of the entire bowling game. It relies on classes in fiducialbowl.py, pincer.py, bowlingmotion.py.
Fiducialbowl.py: This class has two modes. Travel mode is for traveling to the ball in order to pick it up and then traveling back to the bowling alley. Bowling mode is for ensuring centering of the robot along the line with the assistance of the yellow line.
Pincer.py: Controls the opening and closing of the pincer attachment on the platform bot.
Bowlingmotion.py: This node turns until the yellow line is seen, centers the robot along the line, and then performs the quick motion of moving forwards and releasing the ball.
During our time developing the BowlingBot, we encountered several obstacles and challenges that we were forced to overcome and adjust for. Initially, the crowded lab hours slowed down our camera and sensors, peaking at about a minute delay between the camera feed and what was happening in real time. We decided collectively to instead come during office hours when it was less crowded in order to avoid the severe network traffic, which allowed us to test the camera properly.
Another roadblock was finding an appropriate ball, which held up our testing of the bowling motion. We knew we needed a ball that was heavy enough to knock over pins, but small enough to fit inside the pincer. We initially bought a lacrosse ball to test with, but it was too grippy and ended up catching on the ground and rolling under the robot, forcing us to pivot to using a field hockey ball, which was the same size and weight but crucially was free from the grippiness of the lacrosse ball.
Another challenge we had to adapt to was the actual bowling motion. We initially proposed that the robot should implement concepts from the line follower so that it could adjust its course while rolling down the alley. However, we discovered that the robot’s bowling motion was too quick for it to reliably adjust itself in such a short time. To resolve this, we pivoted away from adjusting in-motion and instead implemented aligning itself as best as possible before it moves forward at all.
The BowlingBot project was inspired by the team's love for robotics and bowling. The team was intrigued by the idea of creating a robot that could mimic the game of bowling and we spent lots of time researching and developing the project.
The project was challenging and required us to utilize several complex algorithms and techniques to achieve our objectives. We faced several obstacles, including issues with ball detection and alignment, and had to continuously iterate and refine our design to overcome these challenges.
Despite the challenges, the team was able to successfully develop a functional BowlingBot that could perform the task of bowling. We are excited to showcase our project to our peers and hold a demonstration where participants can compete against the robot.
Overall, the BowlingBot project was a success, and the team learned valuable lessons about robotics, problem-solving, and combining several class concepts into a more complex final product.
Names: Isaac Goldings (isaacgoldings@brandeis.edu), Jeremy Huey (jhuey@brandeis.edu), David Pollack (davidpollack@brandeis.edu)
Instructor: Pito Salas (rpsalas@brandeis.edu)
Date: 05/03/2023
Github repo: https://github.com/campusrover/COSI119-final-objectSorter
This Object Sorter robot uses qrcode/fiducial detection and color detection to find cans and then pick them up with a claw and drop them off at designated sorted positions. In this implementation, the robot is mobile and holds a claw for grabbing objects. The robot executes a loop of finding an item by color, grabbing it, searching for a dropoff fiducial for the correct color, moving to it, dropping it off, and then returning to its pickup fiducial/area.
The project runs via the ros environment on linux, requires some publically available ros packages (mostly in python), and runs on a custom "Platform" robot with enough motor strength to hold a servo claw and camera. Ros is a distributed environment running multiple processes called nodes concurrently. To communicate between them, messages are published and subscribed to. The robot itself has a stack of processes that publish information about the robot's state, including its camera image, and subscribes to messages that tell it to move and open and close the claw.
Our project is divided up into a main control node that also includes motion publishing, and two nodes involved with processing subscribed image messages and translating them into forward and angular error. These are then used as inputs to drive the robot in a certain direction. The claw is opened and closed when the color image of the soda can is a certain amount of pixel widths within the camera's image.
The project runs in a while loop, with different states using control from the two different image platforms at different states until it is finished with a finished parameter, in the current case, when all 6 cans are sorted after decrementing.
Our plan for this project is to build a robot that will identify and sort colored objects in an arena.
These objects will be a uniform shape and size, possible small cardboard boxes, empty soda cans, or another option to be determined. The robot will be set up in a square arena, with designated locations for each color.
Upon starting, The robot will identify an object, drive towards it, pick it up using the claw attachment, and then navigate to the drop off location for that color and release it. It will repeat this until all the objects have been moved into one of the designated locations.
Color detection robots and robotic arms are a large and known factor of industrial workflows. We wanted to incorporate the image detection packages and show its use in a miniature/home application.
The project has been realized almost exactly to the specifications. We found that a bounding arena was not neccesary if we assumed that the travelling area was safe to the robot and the project. This implementation melds two detection camera vision algorithms and motion control via error feedback loop.
The current version uses three cans of two different colors, sorts the 6 cans, and finishes. We found some limitations with the project, such as network traffic limiting the refresh information of the visual indicators.
The first vision algorithm is to detect fiducials, which look like qr codes. The fiducials are printed to a known dimension so that the transformation of the image to what is recognized can be used to determine distance and pose-differential. The aruco_detect package subscribes to the robot's camera image. It then processes this image and returns an array of transforms/distances to each fiducial. The package can recognize the distinctness between fiducials and searches for the correct one neede in each state. The transform is then used to determine the amount of error between then robot and it. Then the robot will drive ion that direction, while the error is constantly updated with new processed images. (See Section: Problems that were Solved for issues that arose.)
The second vision algorithm is to detect color within the bounds of the camera image. The camera returns a color image, and the image is filtered via HSV values to seek a certain color (red or green). A new image is created with non-filtered pixels (all labelled one color) and the rest is masked black. A contour is drawn around the largest located area. Once the width of that contour is a large enough size in the image, the claw shuts. The processing thus can detect different objects, and the robot will go towards the object that is the clsoest due to its pixel count. (See Section: Problems that were Solved for issues that arose.)
The above picture shows (starting with the upper most left picture and going clockwise):
A centroid (light blue dot) that is in the middle of the colored can of which is used as a target for the robot to move towards. The centroid is calcuated using the second vision algorithm by calculating the middle of the contour that is drawn around the largest located area.
The contour that is drawn around the largest located error.
The image that is created with one color isolated and all other colored pixels masked in black.
Our project is to get a platform robot with a claw mount to sort soda cans into two different areas based on color. The test area is set up with two fiducials on one side and one fiducial on the other, approximately 2 meters apart. The two fiducials are designated as the red and green drop-off points, and the one is the pickup point. Six cans are arranged in front of the pickup point with the only requirements being enough spacing so the robot can reverse out without knocking them over, and a direct path to a can of the color the robot is targeting (e.x. so it doesn’t have to drive through a red can to get to a green one). The robot starts in the middle of the area facing the pickup point.
The robot’s behavior is defined by three states, “find item,” “deliver item,” and “return to start.” For “find item” the robot uses computer vision to identify the closest can of the target color, and drive towards it until it is in the claw. Then it closes the claw and switches state to “deliver item.” For this state, the robot will rotate in place until it finds the fiducial corresponding to the color of can it is holding, then drive towards that fiducial until it is 0.4 meters away. At that distance, the robot will release the can, and switch to “return to start.” For this last state, the robot will rotate until it finds the pickup fiducial, then drive towards it until it is 1 meter away, then switch back to “find item.” The robot will loop through these three states until it has picked up and delivered all the cans, which is tracked using a decrementing variable.
This project consists of three main nodes, each with their own file, main_control.py, contour_image_rec.py, and fiducial_recognition.py.
contour_image_rec.py uses the raspicam feed to calculate the biggest object of the target color within the field of view, and publishes the angle necessary to turn to drive to that object. It does this by removing all pixels that aren’t the target color, then drawing a contour around the remaining shapes. It then selects the largest contour, and draws a rectangle around it. After that it calculates the middle of the rectangle and sends uses the difference between that and the center of the camera to calculate the twist message to publish.
Fiducial_recognition.py just processes the fiducials and publishes the transforms.
We wanted to do a project that had relatable potential and worked on core issues with robotics. Settling on this topic, we found that having to integrate two different camera algorithms provided a higher level of interest. In deciding to sort cans, we liked that these were recognizable objects. It was hoped that we could detect based on the plain color of the cans, Coke, Canada Dry Raspberry, Sprite, AW Root Beer. For simplicity, we did tape the tops of the green cans to give more consistency, but it was noted that the Sprite cans would work well still with some minor tweaking.
For motion control, using the direct error from the two detected objects provided reasonable levels of feedback. We put the components into a state controller main node, and then wrapped all the camera outputs, nodes into a single launch node. The launch node also automatically starts aruco_detect.
We worked collaboratively on different parts of the project together. We slowly got piece by piece working, then combined them together into a working roslaunch file. We focused on creating a working production launch file and continued to work on an in-progress one for new material. By breaking down the porject into separate parts, we were able to work separately asynchronously, while meeting up to collaborate on the design of the project. It was a great time working with the other members.
Collecting aruco_detect, rqt_image_view, main_control, fiducial_recognition, contour_image_rec into one file. Controlling version for production.
Considering alternate control flows: behavior trees, finite state machines (not used).
Getting fiducial recognition to work, move and alternate between different fiducials.
Fidicial-based issues: Recognition only worked to a certain distance, after that, the image resolution is too low for certainty. To resolve this, we allowed the bounds of the project to remain within 3 meters.
Network traffic (more other robots/people) on the network would introduce significant lag to sending images across the network from the robot to the controlling software (on vnc on a separate computer). This would cause things such as overturning based on an old image, or slow loading of the fiducial recognition software. This can be worked around by: a. increasing the bandwidth related to the project, b. buffering images, c. reducing the size or performing some calculations on the robot's Raspberry Pi chip (this is limited by the capacity of that small chip), d. changing and reducing speed parameters when network traffic is high manually (allowing less differential between slow images and current trajectory).
Positions where the entirely of the fiducial is too close and gets cropped. Fiducial recognition requires the entire image to be on screen. This information can be processed however and saved, either as a location (which can be assessed via mapping) or as previous information of error. To combat this issue, we raised the positions of the fiducials so that they could be seen above the carried soda can and had the drop off point at 0.4m away from the fiducial.
Color-based issues: Different lighting conditions (during night vs day coming in from the window) affect color detection. Therefore it is best to get some colors that are very distinct and non-reflective (becomes white). Thus red and green. Another issue that would arise is if the robot approaches the cans from the side and the can remains on the side, then the width might not increase enough to close the claw. Some conditional code can be used to clode the claw with smaller width if the contour is in some part of the screen.
Other/Physical issues: The platform robot is a big chonker! It also has meaty claws. The robot being large causes it to take up more room and move farther. In the process it sometimes will knock over other features. To combat this, we added a reversing -0.05m to the turning motion when the robot begins to switch to seeking a dropoff fiducial. The meaty claws is one of the causes of requiring a larger robot with stronger motors.
In sum, we had an enjoyable time working with our Platform Robot, and it was great to see it complete its task with only the press of a single button. The autonimity of the project was a great experience.
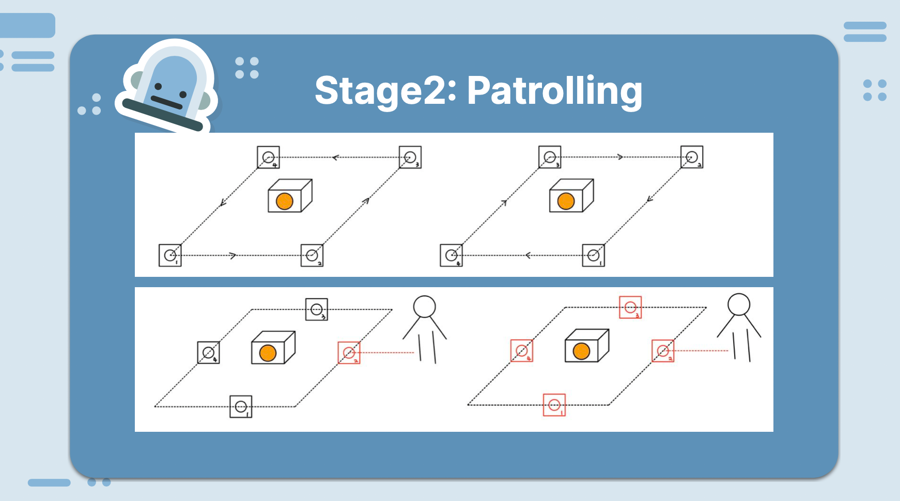
The home above is divided into four security zones.
We can think of them as a sequence, ordered by their importance: [A, B, C, D].
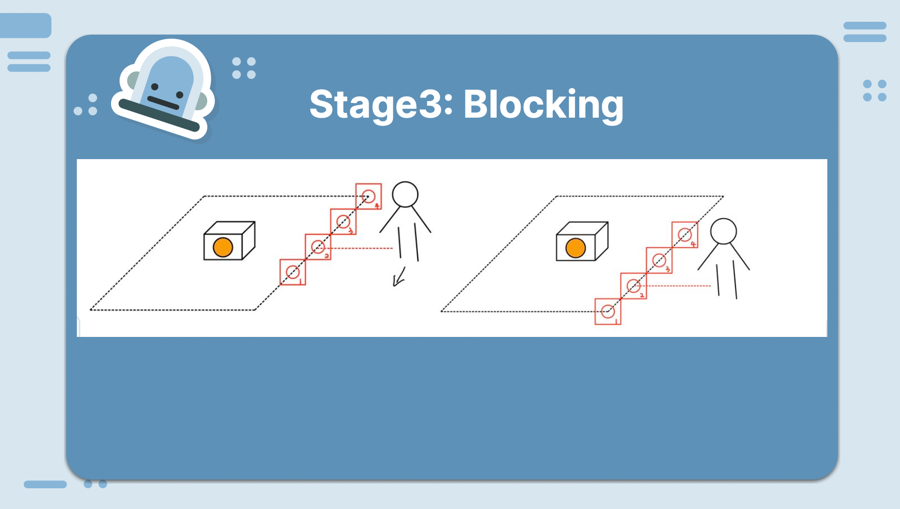
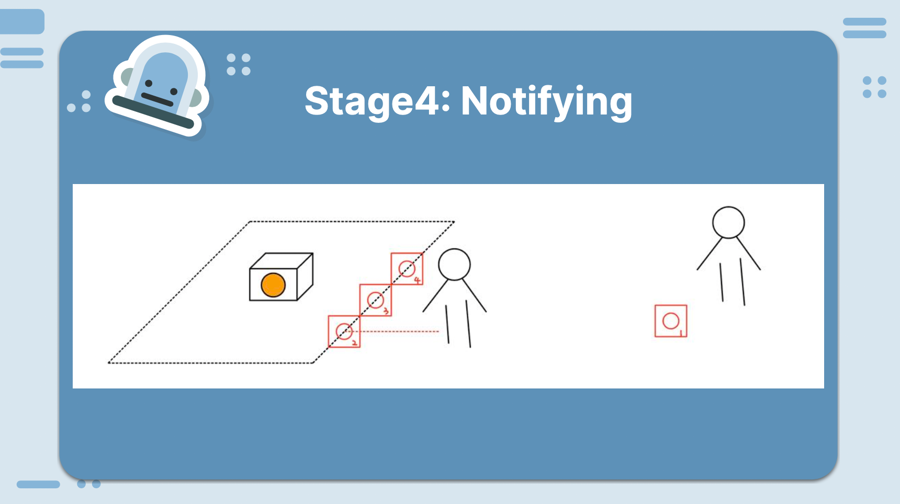
If we have n live robots, we want the first n zones in the list to be patrolled by at least one robot.
We need to:
map the home
SLAM (Simultaneous Localization and Mapping) with the gmapping package
Two points of entry: real_main.launch and sim_main.launch.
real_main.launch:
used for real-world surveillance of our home environment
Based on Diego Ongaro et al. 2014, “In Search of an Understandable Consensus Algorithm”
The full Raft algorithm uses a replicated state machine approach to maintain a set of nodes in the same state. Roughly:
Every node (process) starts in the same state, and keeps a log of the commands it is going to execute.
Background:
Each of the robots is represented as an mp (member of parliament) node.
mp_roba, mp_rafael, etc.
The election timeout feature is part of what enables leader resiliency in my code.
When a leader node is killed, one of the follower nodes time out and become the new leader.
roscore keeps a list of currently active nodes. So:
The mp nodes are all running on the remote VNC computer, which also runs the roscore.
So killing the mp node is just a simulation of robot failure, not true robot failure.
We’re just killing a process on the vnc computer, not the robot itself
The LEA is fairly modular, and the algorithm can be adapted to tasks other than patrolling.
It would work best for tasks which are clearly ordered by priority, and which are hazardous, or likely to cause robot failures.
Completely fanciful scenarios:
James Lee (leejs8128@brandeis.edu)
A special thanks to Adam Ring, the TA for the course, who helped with the project at crucial junctures.
Project Report for Robot Race Team: Sampada Pokharel (pokharelsampada@brandeis.edu) and Jalon Kimes (jkimes@brandeis.edu) Date: May 4, 2023 Github repo: https://github.com/campusrover/robot_race
For our final project, we wanted to create a dynamic and intuitive project that involved more than one robot. To challenge ourselves, we wanted to incorporate autonomous robots. As the technology for self-driving cars continues to advance, we are curious about the process involved in creating these vehicles and wanted to explore the autonomous robot development process. To explore this further, we have come up with the concept of a race between two autonomous robots. The goal for this project was to program robots into racing in the track indefinitely all while following certain rules and avoiding obstacles throughout the track.
Our main objective is for the robots to autonomously move itself in the race track with 2 lanes (4 lines) avoiding any collision. The plan was to do so by following the center of a lane made by 2 lines, slowing down, and switching into a different lane. We were able to use the contour system to detect multiple objects within a mask and draw centroids on them. For our purposes we wanted it to detect the two lines that make up the lane. With the centroids we could calculate the midpoint between the lines and follow that. We got a prototype running, however it struggled to turn corners. For the sake of time we pivoted to only following one line per robot. The current Robot Race is an algorithm that allows two autonomous robots to race each other, collision free, on a track with two lines, speed bumps, and obstacles along the way.
We designed our code to have the robot recognize a line by its color and follow it. While it is doing that it is also looking for yellow speed bumps along the track. When it detects yellow on the tract the robot will slow down until it passes over the speed bump. Furthermore, when the robot detects an obstacle in front of it, it will switch lanes to move faster avoiding the obstacle.
The main package that drives our project is the opencv stack. This contains a collection of tools that allow us to use computer vision to analyze images from the camera on the robot. We used the CV bridge package to process the images. As the name suggests CV bridge allows us to convert the ROS messages into OpenCV messages. The camera onboard the robot publishes the images as ROS messages into different types of CV2 images. For our use case, we converted the images from the camera into color masks. To create the color masks we used the HSV color code to set upper and lower bounds for the range of colors we want the mask to isolate. For example, for red the lower bound was: HSV [0,100,100] and the upper bound was: HSV [10,255,255]. The mask will then block out any color values that are not in that range.
Figure 1
To figure out the color code we had to calibrate the camera for both robots using the cvexample.py file with the RQT app to adjust the HSV mask range live. After that we convert the color mask to a grayscale image and it's ready for use.
We created masks for the green and red lines that the robot will follow and the yellow speed bumps scattered along the track. We set each robot to follow a specific line and also be scanning for yellow at the same time. This was achieved by drawing centroids on the line (red or green) for the robot to follow.
We also use lidar in our project. Each robot is scanning the environment for obstacles. The robots have the ability to switch lanes by swapping the red and green masks out when it detects an obstacle on the track with lidar. We subscribed to the laser scan topic to receive ros messages from the equipped Lidar sensor. After some testing and experimenting we decided If It detects an object within 1.5 meters of the front of the robot it will switch lanes. We had to make sure that the distance threshold was far enough for the robot to switch lanes before crashing but not too far to detect the chairs and tables in the room.
Clone our repository: “git clone https://github.com/campusrover/robot_race.git”
ssh into two robots for each robot run:
Go into vnc and run roslaunch robot_race follow_demo.launch
This should get the robots to move on their respective lines.
Launch File Follow_demo.launch - The main launch file for our project
Nodes Follow.py - main programming node
At the very beginning, we were dancing with the idea of working on two robots and having them follow the traffic rules as they start racing on the track for our final project. However, as we started learning more about image processing and worked on the line following PA, we wanted to challenge ourselves to work with two autonomous robots. With the autonomous robots in mind, we then decided to discard the traffic lights and just create a simple track with speed bumps and walls on the lanes.
We faced many problems throughout this project and pivoted numerous times. Although the project sounds simple, it was very difficult to get the basic algorithm started. One of our biggest challenges was finding a way for the robot to stay in between two lanes. We tried to use the HoughLines algorithm to detect the lines of our lanes, however, we found it extremely difficult to intricate our code as HoughLines detected odd lines outside of our track. When HoughLines didn’t work, we pivoted to using a contours-based approach. Contours allow you to recognize multiple objects in a mask and draw centroids on them. We used this to draw centroids on the two lines and calculated the midpoint in between two lines for the robot to follow. While we were successful in creating a centroid in between the lines for the robot to follow on the gazebo, when we tried to run the program on the actual robot, the robot did not stay in between the two lanes when it needed to turn a corner(Figure 2). At last, we pivoted and decided to replace the lanes with two different tapes, red and green, for the robots to follow.
Figure 2
Furthermore, we wanted to create an actual speed bump using cardboards but we soon realized that would be a problem since we wanted to use the small turtle bots for our project and they were unable to slow down and go up the speed bump. Furthermore, the lidars are placed at the top of the robot and there is little to no space at the bottom of the robot to place a lidar. A solution we came up with was to use yellow tape to signal speed bumps.
Once we were able to get the robots to follow the two lines, we had difficulty getting the robot to slow down when it detected the speed bump. We had separated the main file and the speed bump detector file. The speed bump detector file created a yellow mask and published a boolean message indicating if yellow was detected in the image. After discussing it with the TA and some friends from class we found out that we could not pass the boolean messages from the speedbump node to the main file without changing the xml file. We originally planned to do the same for object detection but did not want to run into the same problem. Our solution was to combine everything into one file and the speed bump and object detector nodes became methods.
Overall, we consider this project to be a success. We were able to create and run two autonomous robots simultaneously and have them race each other on the track all while slowing down and avoiding obstacles. Although we faced a lot of challenges along the way, we prevailed and were able to finish our project on time. The knowledge and experience gained from this project are invaluable, not only in the field of self-driving cars but also in many other areas of robotics and artificial intelligence. We also learned the importance of teamwork, communication, and problem-solving in the development process. These skills are highly transferable and will undoubtedly benefit us in our future endeavors.
Benjamin Blinder benjaminblinder@brandeis.edu
Ken Kirio kenkirio@brandeis.edu
Vibhu Singh vibhusingh@brandeis.edu
The project coordinates a stationary arm robot and a mobile transportation robot to load and unload cargo autonomously. We imagine a similar algorithm being used for loading trucks at ports or in factory assembly lines.
There are three phases: mapping, localization, and delivery.
First, the robot drives around and makes a map. Once the map is made, a person will manually drive the robot to a delivery destination and press a button to indicate its location to the robot. Then the person will manually have to drive the robot back to the loading point and mark that location as well. With this setup, the robot can start working as the delivery robot and transporting cubes from the loading zone to the arm.
In the delivery phase, a person loads a piece of cargo - we used a 3D printed cube - onto the robot and then presses a button to tell the robot that it has a delivery to make. Once there, computer vision is used to detect the cargo and calculate its position relative to the arm. Once the arm receives the coordinates, it determines what command would be necessary to reach that position and whether that command is physically possible. If the coordinates aren’t valid, the transportation robot attempts to reposition itself so that it is close enough for the arm. If the coordinates are valid, the arm will then grab the cube off the loading plate on the robot and place it in a specified go. Finally, the transportation robot will go back to the initial home zone, allowing the process to repeat.
Mapping
Create a map
Localize on a premade map
A flowchart of message passing that must occur between the three main components of this project.
We needed the robot to be able to move autonomously and orient itself to the arm, so we decided to use SLAM to create a map and the AMCL and move_base packages to navigate. Using SLAM, we use the LiDAR sensor on the robot to create a map of the room, making sure we scan clear and consistent lines around the arm and the delivery zone. We then save the map and use AMCL to generate a cost map. This also creates a point cloud of locations where the robot could be according to the current LiDAR scan. Then, we manually moved the robot through the map in order to localize the robot to the map and ensure accurate navigation. We then capture the position and orientation data from the robot for a home and delivery location, which is then saved for future navigation. Finally, we can tell the robot to autonomously navigate between the two specified locations using the move_base package which will automatically find the fastest safe route between locations, as well as avoid any obstacles in the way.
Cargo is detected via color filtering. We filter with a convolutional kernel to reduce noise, then pass the image through bitwise operators to apply the color mask. The centroid is converted from pixels to physical units by measuring the physical dimensions captured by the image.
Since commands to the arm are sent in polar coordinates, the cartesian coordinates obtained from the image are then converted into polar. These coordinates must then be transformed into the units utilized by the arm, which have no physical basis. We took measurements with the cargo in various positions and found that a linear equation could model this transformation, and utilized this equation to determine the y-coordinate. However, the x-coordinate could not be modeled by a linear equation, as the arm's limited number of possible positions along this axis made it impossible to determine a strong relationship between the coordinates. In addition, whether the cargo was parallel or at an angle to the arm affected the location of the ideal point to grab on the cargo. Instead we calculated the x-position by assinging the position and orientation of the cargo to states, which were associated with a particular x-coordinate.
Arm robot
The arm robot needs to be elevated so that it can pick up the cube. Ensure that the setup is stable even when the arm changes positions, using tape as necessary. Determine the z-command required to send the arm from the "home" position (see ) to the height of the cargo when it is loaded on the transportation robot. This will be one parameter of the launch file.
Camera
The camera should be set in a fixed position above the loading zone, where the lens is parallel to the ground. The lab has a tripod for such purposes. Record the resolution of the image (default 640x480) and the physical distance that the camera captures at the height of the cargo when placed on the transportation robot. These will also be parameters for the launch file.
Run roslaunch cargoclaw transport_command.launch. Separately, run roslaunch cargoclaw arm_command.launch with the following parameters:
arm_z: z-command from the arm's position to pick up the cargo from the transportation robot (Setup #1)
width_pixels/height_pixels: Image resolution (Setup #2)
width_phys/height_phys: Physical dimensions captured in the image at the height of the cargo (Setup #2)
Mode 1: Mapping Use teleop to drive the robot between the loading and unloading zones. Watch rviz to ensure adequate data is being collected.
Mode 2: Localizing Use teleop to drive the robot between the loading and unloading zones. Watch rviz to ensure localization is accurate. Press the "Set Home" button when the robot is at the location where cargo will be loaded. Press the "Set Goal" button when the robot is at the location of the arm.
Mode 3: Running When the cargo is loaded, press "Go Goal". This will send the robot to the loading zone where the loading/unloading will be done autonomously. The robot will then return to the home position for you to add more cargo. Press "Go Goal" and repeat the cycle. The "Go Home" button can be used if the navigation is not working, but should not be necessary.
Nodes
Messages
We began by trying to send commands to the robotic arm through ROS. While the arm natively runs proprietary software, Veronika Belkina (hyperlink?) created a package that allows for ROS commands to control the arm which we decided to utilize. The arm is controlled via USB so first we had to set up a new computer with Ubuntu and install ROS. Our first attempt was unsuccessful due to an unresolved driver error, but our second attempt worked. This step took a surprising amount of time, but we learned a lot about operating systems while troubleshooting in this stage.
Simultaneously, we researched the arm capabilities and found that the arm can pick up a maximum weight of 30g. This required that we create our own 3D printed cubes to ensure that the cargo would be light enough. All cubes were printed in the same bright yellow color so that we could use color filtering to detect the cube.
Next, we tested our code and the cubes by coding the arm to pick up a piece of cargo from a predetermined location. This step was difficult because commands for the x/z-coordinates are relative, while commands for the y-coordinate are absolute. After this test worked, we made the node more flexible, able to pick up the cargo from any location.
With the arm working, we then began working on the image processing to detect the cargo and calculate its location. First we had to set up and calibrate the USB camera using the usb_cam package. Then we began working on cargo detection. Our first attempt used color filtering, but ran into issues due to the difference in data between the USB camera and the robots' cameras. We then tried applying a fiducial to the top of the transportation robot and using the aruco_detect package. However, the camera was unable to reliably detect the fiducial, leading us to return to the color detection method. With some additional image transformation and noise reduction processing, the color detection was able to reliably identify the cargo and report its centroid. Then, since the height of the transportation robot is fixed we were able to calculate the physical location of the cargo based on the ratio of pixels to physical distance at that distance from the camera. Using this information, we created another node to determine whether the cube is within the arm's range to pick up. We found converting the physical coordinates to the commands utilized by the arm to be extremely difficult, ultimately deciding to take many data points and run a regression to find a correlation. With this method we were relatively successful with the y-coordinate, which controlled the arm's rotation.
Simultaneously, we coded the transportation robot's autonomous navigation. We realized our initial plan to combine LIDAR and fiducial data to improve localization would not work, as move_base required a cost map to calculate a trajectory while fiducial_slam saved the coordinates of each detected fiducial but did not produce a cost map. We decided to move forward by using slam_gmapping, which utilized lidar data and did produce a cost map. This allowed us to use move_base to reach the approximate location of the arm, and fine-tune the robot's position using fiducial detection as necessary. However, upon testing, we realized move_base navigation was already very accurate, and trading control between the move_base and a fiducial-following algorithm resulted in unexpected behavior, so we decided to just use move_base alone.
Finally, we attempted to combine each of these components. Although move_base allowed for good navigation, we found even slight differences in the orientation of the robot in the delivery zone resulted in differences in the coordinates necessary to grab the cargo. We decided to make the image processing component more robust by pivoted to using polar rather than cartesian coordinates when calculating the commands to send to the arm, as the arm's x- and y-coordinates correspond to its radius and angle. We then used different approaches for transforming the x- and y-coordinates into commands. The arm had very limited range of motion along its x-axis, making it practical to measure the cargo's location at each position and pick the x-command which most closely corresponded to the cargo's location. However, the robot had a much greater range along its y-axis, leading us to take measurements and perform a cubic regression to get an equation of the command for a given y-coordinate. In addition, we added further tuning after this step, as the cargo's orientation required that the arm move increasingly along its y-axis to pick up a piece of cargo that is angled compared to the arm's gripper.
Working as a team was very beneficial for this project. Although we all planned the structure of the project and overcame obstacles as a team, each person was able to specialize in a different area of the project. We had one person work on the arm, another on image processing, and another on the transportation robot.
The idea of the autopilot robot was simple – it’s a mobile robot augmented with computer vision, but it’s a fun project to work on for people wishing to learn and combine both robotics and machine learning techniques in one project. Evenmore, one can see our project as miniature of many real world robots or products: robot vacuum (using camera), delivery robot and of course, real autopilot cars; so this is also an educative project that can familiarize one with the techniques used, or at least gives a taste of the problems to be solved, for these robots/products.
Able to follow a route
Able to detect traffic signs
Able to behave accordingly upon traffic signs
What was created
Technical descriptions, illustrations
There are five types and two groups of traffic signs that our robot can detect and react to. Here are descriptions of each of them and the rules associated with them upon the robot’s detection.
Traffic light (See Fig1)
Red light: stops movement and restarts in two seconds.
Orange light: slows down
Green light: speeds up
Turn signs (See Fig2)
Left turn: turn left and merge into the lane
Right turn: turn right and merge into the lane
All turns are 90 degrees. The robot must go straight and stay in the lane if not signaled to turn.
2. Discussion of interesting algorithms, modules, techniques
The meat of this project is computer vision. We soon realized that different strategy can be used the two groups of traffic signs as they have different types of differentiable attributes (color for traffic lights and shape for turning signs).Therefore, we used contour detection for traffic lights, and we set up a size and circularity threshold to filter noise out noise. Turning signs classification turned out to be much harder than we initially expected in the sense that the prediction results seem to be sometimes unstable, stochastic, and confusing (could be because of whatever nuance factors that differ in the training data we found online and the testing data (what the robot sees in lab).
We tried SVM, Sift, and CNN, and we even found a web API for traffic signs models that we integrated into our project – none of them quite work well.
Therefore we decided to pivot to another more straightforward approach: we replaced our original realistic traffic signs (Fig2a) with simple arrows (Fig2b), and then what we are able to do is that:
Detect the blue contour and crop the image from robot’s camera to a smaller size
Extract the edges and vertices of the arrow, find the tip and centroid of it
Classify the arrow’s direction based on the relative position of the tip to the centroid
Two more things worth mentioning on lane following:
Our robot follows a route encompassed by two lines (one green and one red) instead of following one single line. Normally the robot uses contour detection to see the two lines and then computes the midpoint of them. But the problem comes when the robot turns – in this case, the robot can only see one colored line. The technique we use is to only follow that line and add an offset so that the robot turns back the the middle of the route (the direction of the offset is based on the color of that line)
How we achieve turning when line following is constantly looking for a midpoint of a route. What we did is that we published three topics that are named “/detect/lane/right_midpoint”, “/detect/lane/midpoint”, “/detect/lane/left_midpoint”. In this case there are multiple routes (upon an intersection), the robot will choose to turn based on one of midpoint position, based on the presence turning sign. By default, the robot will move according to the “/detect/lane/midpoint” topic.
Table 1. Nodes and Messages description
Story of the project
How it unfolded, how the team worked together
At the very beginning of our project, we set these three milestones for our work:
And we have been pretty much following this plan, but as one can tell, the workload for each phase is not evenly distributed.
Milestone 1 is something we’ve already done in assignment, but here we use two lines to define a route instead of just one single line, and the complexity is explained above. Traffic light classification was pretty straightforward in the hindsight. We simply used color masking and contour detection. To avoid confusing the robot between red green lines that define the route, and the red green traffic signs, we set up a circularity and area threshold. We spent the most time on milestone 3. We experimented with various methods and kept failing until we decided to simply our traffic signs – more details are explained in section 8. Our team worked together smoothly. We communicated effectively and frequently. As there are three of us, we divided the work into lane detection and following, traffic light classification, and sign classification and each of us works on a part to maximize productivity. After each functionality is initially built, we worked closely to integrate them and debug together.
problems that were solved, pivots that had to be taken
The first problem or headache we encountered is that we use a lot of colors for object detection in this project, so we had to spend a great amount of time tuning HSV values of our color-of-interest, as slight changes in background lighting/color mess up with it.
The more challenging part is that, as alluded to above, turning signs classification is more difficult than we initially expected. We tried various model architectures, including CNN, SVM, SIFT, and linear layers. No matter what model we choose, the difficulty comes from the inherent instability of machine learning models. Just to illustrate it: we found a trained model online that was trained on 10000 traffic signs images, for 300 epochs, and reached a very low loss. It is able to classify various traffic signs – stop sign, rotary, speed limit, you name it. But sometimes, it just failed on left turn and right turn classification (when the image is clear and background is removed), and we didn’t figure out a great solution on remediating this. So instead we piloted away from using machine learning models and replaced curved traffic signs (Fig 2a) with horizontal arrows (Fig 2b). The detail of the algorithm is discussed in section 4.
Your own assessment
We think that this has been a fun and fruitful experience working on this project. From this semester’s work, we’ve all had a better appreciation of the various quirky problems in robotics – we had to basically re-pick all the parameters when we migrated from gazebo world the the real lab, and also we literally had to re-fine-tune the hsv values everytime we switched to a new robot because of the minute difference in background lighting and each robot’s camera. So if one thing we learned from this class, it’s real Robots Don't Drive Straight. But more fortunately, we’ve learned a lot more than this single lesson, and we’re able to use our problem solving and engineering skills to find work-arounds for all those quirky problems we encountered. Therefore, in summary we learned something from every failure and frustration, and after having been through all of these we’re very proud of what we achieved this semester.
#!/usr/bin/env python

'''
A module with a GPS node.

GPS2IP: http://www.capsicumdreams.com/gps2ip/
'''

import json
import re
import rospy
import socket

from std_msgs.msg import String

class GPS:
    '''A node which listens to GPS2IP Lite through a socket and publishes a GPS topic.'''
    def __init__(self):
        '''Initialize the publisher and instance variables.'''
        # Instance Variables
        self.HOST = rospy.get_param('~HOST', '172.20.38.175')
        self.PORT = rospy.get_param('~PORT', 11123)

        # Publisher
        self.publisher = rospy.Publisher('/gps', String, queue_size=1)

    def ddm_to_dd(self, degrees_minutes):
        degrees, minutes = divmod(degrees_minutes, 100)
        decimal_degrees = degrees + minutes / 60
        return decimal_degrees

    def get_coords(self):
        '''A method to receive the GPS coordinates from GPS2IP Lite.'''
        # Instantiate a client object
        with socket.socket(socket.AF_INET, socket.SOCK_STREAM) as s:
            s.connect((self.HOST, self.PORT))
            # The data is received in the RMC data format
            gps_data = s.recv(1024)

        # Transform data into dictionary
        gps_keys = ['message_id', 'latitude', 'ns_indicator', 'longitude', 'ew_indicator']
        gps_values = re.split(',|\*', gps_data.decode())[:5]
        gps_dict = dict(zip(gps_keys, gps_values))

        # Cleanse the coordinate data
        for key in ['latitude', 'longitude']:
            # Identify the presence of a negative number indicator
            neg_num = False

            # The GPS2IP application transmits a negative coordinate with a zero prepended
            if gps_dict[key][0] == '0':
                neg_num = True

            # Transform the longitude and latitude into decimal degrees
            gps_dict[key] = self.ddm_to_dd(float(gps_dict[key]))

            # Apply the negative if the clause was triggered
            if neg_num:
                gps_dict[key] = -1 * gps_dict[key]

        # Publish the decoded GPS data
        self.publisher.publish(json.dumps(gps_dict))

if __name__ == '__main__':
    # Initialize a ROS node named GPS
    rospy.init_node("gps")

    # Initialize a GPS instance with the HOST and PORT
    gps_node = GPS()

    # Continuously publish coordinated until shut down
    while not rospy.is_shutdown():
gps_node.get_coords()#!/usr/bin/env python
'''
A module for a node that alters the quality of the image.
'''
import cv2
import numpy as np
import re
import rospy
from cv_bridge import CvBridge
from sensor_msgs.msg import CompressedImage
from std_msgs.msg import String
class Compressor:
''''''
def __init__(self):
'''Initialize necessary publishers and subscribers.'''
# Instance Variables
# Initialize an object that converts OpenCV Images and ROS Image Messages
self.cv_bridge = CvBridge()
# Image Resolution
self.img_res = {
'height': 1080,
'width': 1920
}
# Publisher - https://answers.ros.org/question/66325/publishing-compressed-images/
# self.publisher = rospy.Publisher('/camera/rgb/image_res/compressed', CompressedImage, queue_size=1)
self.publisher = rospy.Publisher('/raspicam_node/image_res/compressed', CompressedImage, queue_size=1)
# Subscribers
# self.subscriber_cam = rospy.Subscriber('/camera/rgb/image_raw/compressed', CompressedImage, self.callback_cam, queue_size=1)
self.subscriber_cam = rospy.Subscriber('/raspicam_node/image/compressed', CompressedImage, self.callback_cam, queue_size=1)
self.subscriber_set = rospy.Subscriber('/image_configs', String, self.callback_set, queue_size=1)
def callback_cam(self, msg):
'''A callback that resizes the image in line with the specified resolution.'''
# Convert CompressedImage to OpenCV
img = self.cv_bridge.compressed_imgmsg_to_cv2(msg)
# Apply New Resolution
img = cv2.resize(img, (self.img_res['height'], self.img_res['width']))
# Convert OpenCV to CompressedImage
msg_new = self.cv_bridge.cv2_to_compressed_imgmsg(img)
# Publish
self.publisher.publish(msg_new)
def callback_set(self, msg):
'''A callback to retrieve the specified resolution from the web client.'''
img_set = re.split(',', msg.data)
self.img_res['height'] = int(img_set[0])
self.img_res['width'] = int(img_set[1])
if __name__ == "__main__":
rospy.init_node("img_comp")
comp = Compressor()
rospy.spin()#!/usr/bin/env python
import rospy
from std_msgs.msg import String
import subprocess
def get_ros_topics():
"""
Returns a list of active ROS topics using the `rostopic list` command.
"""
command = "rostopic list"
process = subprocess.Popen(command.split(), stdout=subprocess.PIPE)
output, error = process.communicate()
topics = output.decode().split("\n")[:-1] # remove empty last element
return topics
def rostopic_list_publisher():
"""
ROS node that publishes the list of active ROS topics as a string message.
"""
rospy.init_node('rostopic_list_publisher', anonymous=True)
pub = rospy.Publisher('/rostopic_list', String, queue_size=10)
rate = rospy.Rate(1) # 1 Hz
print("[INFO] Robot.py node has been started!")
while not rospy.is_shutdown():
1 topics = get_ros_topics()
message = ",".join(topics)
pub.publish(message)
rate.sleep()
if __name__ == '__main__':
try:
rostopic_list_publisher()
except rospy.ROSInterruptException:
passProd_v5.launch is our launch file, it starts the main_control node, the image recognition node, the fiducial recognition node, and the aruco_detect node that our fiducial recognition node relies on.
Detecting and masking by HSV range, contouring the largest clump, bounding that with a rectangle, sending a centroid.
Grabbing cans with the claw (sending/recieving servo commands), using the width of the rectangle to time closing of the claw.
Developing a loop control between states.
Troubleshooting physical problems, such as the cans blocking the fiducial image.


Perform autonomous navigation between two fixed points
Image processing
Recognize the cargo
Calculate the physical location of the cargo
Robotic arm
Coordinate commands on a robot that does not run ROS natively
arm_cam
Accepts image of the delivery zone from the camera, detects the cargo with color filtering, and calculates and publishes its physical location
box_pickup
Accepts the coordinates published from arm_cam and uses a linear regression to determine the y transform and a set of ranges to determine the x transform
cargo_bot
Directly controls the motion of the Alien Bot using cmd_vel and move_base
cargo_gui
User interface which allows control of the robot as well as setting the mapping and navigation points
alien_state
True if the transportation robot has finished navigating to the delivery zone. Published by `cargo_bot` and subscribed to by `arm_cam`.
cargo_point
The physical position of the cargo. Published by `arm_cam` and subscribed to by `box_pickup`.
UI
A string of information relaying the state, position, and time since the last input for the robot which is published to `cargo_gui` for display
keys
A string that directs robot movement. Published from `cargo_gui` to `cargo_bot`.
arm_status
A string relaying whether the location of the cargo can be picked up by the arm, and if so, when the arm has finished moving the cube. This informs the transportation robot's movement in the delivery zone. Published by `box_pickup` and subscribed to by `cargo_bot`.


     $(bru mode real)
    $(bru name <robot name> -m <myvpnip>)
    multibringup
n== 2 → patrolled(A, B);
n == 3 → patrolled(A, B, C)
1 <= n <= 4
The goal is for this condition to be an invariant for our program, despite robot failures.
Let robotz refer to the robot patrolling zone Z.
Illustration:
n == 4 → patrolled(A, B, C, D)
robotA dies
n == 3 → patrolled(A, B, C)
robotB dies
n == 2 → patrolled(A, B)
robotA dies
n == 1 → patrolled(A)
have multiple robots patrol the security zone in parallel
AMCL (Adaptive Monte Carlo Localization) and the move_base package
One thread per robot with a SimpleActionClient sending move_base goals
have the system be resilient to robot failures, and adjust for the invariant appropriately
Rely on Raft’s Leader Election Algorithm (‘LEA’) to elect a leader robot.
The remaining robots will be followers.
The leader is responsible for maintaining the invariant among followers.
More on system resiliency:
The leader always patrols zone A, which has the highest priority.
On election, the leader assigns the remaining zones to followers to maintain the invariant.
On leader failure:
global interrupts issued to all patrol threads (all robots stop).
the LEA elects a new leader
On follower failure:
local interrupts issued by leader to relevant patrol threads (some robots stop).
Example:
runs the map_server with the home.yaml and home.png map files obtained by SLAM gmapping.
All robots will share this map_server
launches robots via the real_robots.launch file (to be shown in next slide)
launches rviz with the real_nav.rviz configuration
sim_main.launch:
used for simulated surveillance of gazebo turtlebot3_stage_4.world
works similarly to real_main.launch except it uses a map of stage_4 and sim_robots.launch to run gazebo models of the robots via tailored urdf files.
The algorithm elects a leader node, who ensures that the logs are properly replicated so that they are identical to each other.
Raft’s LEA and log replication algorithm are fairly discrete. We will only use the LEA.
Each node is in one of three states: follower, candidate, or leader.
If a node is a leader, it starts a homage_request_thread that periodically publishes messages to the other nodes to maintain its status and prevent new elections.
Every mp node has a term number, and the term numbers of mp nodes are exchanged every time they communicate via ROS topics.
If an mp node’s term number is less than a received term number, it updates its term number to the received term number.
LEA:
On startup, every mp node is in the follower state, and has:
a term number; and
a duration of time called the election timeout.
When a follower node receives no homage request messages from a leader for the duration of its election timeout, it:
increments its term number;
becomes a candidate;
When a node receives a request vote message it will vote for the candidate iff:
the term number of the candidate is at least as great as its own; and
the node hasn’t already voted for another candidate.
Once a candidate mp node receives a majority of votes it will:
become a leader;
send homage request messages to other nodes to declare its status and prevent new elections.
The election timeout duration of each mp node is a random quantity within 2 to 3 seconds.
This prevents split votes, as it’s likely that some follower will timeout first, acquire the necessary votes, and become the leader.
Still, in the event of a split vote, candidates will:
reset their election timeout durations to a random quantity within the mentioned interval;
wait for their election timeout durations to expire before starting a new election.
followers, before transitioning to candidate state, update their list of live mp nodes by consulting roscore.
leaders do the same via a follower_death_handler thread, which runs concurrently with main thread and the homage_request thread, and maintains the invariant.
We can remedy this by binding the mp node’s life to any other nodes that are crucial to our robot fulfilling its task.
E.g., for our project the /roba/amcl and /roba/move_base nodes are critical.
So we can consult roscore periodically to see if any of these nodes die at any given point. And if they do, we can kill mp_roba.
We can also define and run more fine-grained custom nodes that keep track of any functional status of the robot we’re interested in, and bind the life of those custom nodes to the mp nodes.
Running each mp node on its corresponding robot is a bad idea!
Only if a robot gets totally destroyed, or the mp process fails, will the algorithm work.
Performance will take a hit:
bandwidth must be consumed for messages between mp nodes
robot’s computational load will increase
Our system has a single point of failure; the VNC computer running roscore.
So we have to keep the VNC safe from whatever hostile environment the robots are exposed to.
Maybe this can be remedied in ROS2, which apparently does not rely on a single roscore.
Our patrol algorithm is very brittle and non-adversarial
Depends on AMCL and move_base, which do not tolerate even slight changes to the environment, and which do not deal well with moving obstacles.
There are no consequences to disturbing the patrol of the robots, or the robots themselves (e.g. no alarm or ‘arrests’)
Drone strikes: Maybe certain military targets are ordered by priority, and drones can be assigned to them in a way that targets with a higher priority receive stubborn attention.
Planetary exploration: Perhaps some areas of a dangerous planet have a higher priority that need to be explored than others. Our system could be adapted so that the highest priority areas get patrolled first.


Run “roslaunch autopilot autopilot.launch”, which starts the four nodes used in our project.
Clear description and tables of source files, nodes, messages, actions
YES
Midpoint of a lane
/detect/lane/right_midpoint
MidpointMsg
YES
Midpoint of a left lane (when there’s a branch or cross)
/detect/lane/left_midpoint
MidpointMsg
YES
Midpoint of a right lane (when there’s a branch or cross)
/detect/sign
SignMsg
[string direction
float32 width
float32 height]
YES
Detection of the
/detect/light
LightMsg
[string color
float32 size]
YES
Detection of a traffic light
Cmd_vel
Twist
NO
Publish movement
/raspicam_node/image/compressed
CompressedImage
NO
Receive camera data
/detect/lane/midpoint
MidpointMsg
[int32 x
int32 y
int32 mul]
What is a better use of a robot than to do your homework for you? With the surging use of ChatGPT among struggling, immoral college students, we decided to make cheating on homework assignments even easier. Typinator is a robot that uses computer vision and control of a robotic arm to recognize a keyboard, input a prompt to ChatGPT, and type out the response.
Demonstrate the robotic arm by having it type its own code. The arm will hold an object to press keys with. The robot will hopefully write code quickly enough so that people can watch it write in real time. The robot could also type input to chatgpt, and have a separate program read the output to the robot. It will then cmd+tab into a document and type the answer. Both of these demonstrations will show the arm “doing homework,” which I think is a silly butchallenging way to demonstrate the robot’s capabilities.
The goal of this project is to demonstrate the capability of the robotic arm in conjunction with computer vision.
While the end result of the project is not actually useful in a real world setting, the techniques used to produce the end result have a wide variety of applications. Some of the challenges we overcame in computer vision include detecting contours on images with a lot of undesired lines and glare, reducing noise in contoured images, and transforming image coordinates to real world coordinates.
Some of the challenges we overcame in using a robotic arm include moving to very specific positions and translating cartesian coordinates to polar coordinates since the arm moves by rotating. We also worked extensively with ROS.
Text Publishing
Publish large chunks of text with ROS
Clean text into individual characters that can be typed
The project works by having a central coordinating node connect arm motion, image recognition, keyboard input, and text input. All of these functionalities are achieved through ROS actions except for the connection to the keyboard input, which is done through a simple function call (coordinator --> keys_to_type_action_client). Our goal with designing the project in this way was to keep it as modular as possible. For example, the chatgpt_connection node could be replaced by another node that publishes some other text output to the generated_text ROS topic. A different arm_control node could be a server for the arm_control action if a different robotic arm requiring different code was used. Any of the nodes connected with actions or topics could be substituted, and we often used this to our advantage for debugging.
Arm motion diagram
As shown above, the arm moves with rotation and extension to hover above different keys. To achieve this movement from a flat image with (x,y) coordinates, we converted the coordinates of each key into polar coordinates. From (x,y) coordinates in meters, the desired angle of the arm is determined by $θ=atan(x/y)$. The desired extension from the base of the arm is found by $dist=y/cos(θ)$. We calculate this relative to the current extension of the arm so $Δdist=dist-currentDistance$.
It was found that the arm does not accurately move in this way. As the angle increases, the arm does not adjust its extension by a large enough distance. This can be corrected for, but an exact correction was not found. One correction that works to an acceptable degree of accuracy for angles less than 45 degrees is: $((delta)/math.cos(delta)) - delta$, with $delta$ being some value between 0.07 and 0.09 (the optimized value was not determined and it seems as if the right value changes based on how far the arm is currently extended and to which side the arm is turned). This correction is then added to $dist$.
Keyboard contouring example 1 Keyboard contouring example 2, with a more difficult keyboard to detect
Keyboard recognition was achieved with OpenCv transformations and image contouring. The keys of many different keyboards are able to be recognized and boxes are drawn around them. We were able to achieve key recognition with relatively little noise.
The first transformation applied to an image is optional glare reduction with cv2.createCLAHE(clipLimit=2.0, tileGridSize=(8,8)). Then, the image is converted to greyscale with cv2.cvtColor(img, cv2.COLOR_BGR2GRAY). A threshold is then applied to the image. Different thresholds work for different images, so a variety of thresholds must be tried. One example that often works is cv2.THRESH_OTSU | cv2.THRESH_BINARY_INV. This applies an Otsu threshold followed by a binary inverse threshold. Finally, dilation and blur are applied to the image with customizable kernel sizes.
After the transformations are applied, OpenCV contouring is used with contours, hierarchy = cv2.findContours(img, cv2.RETR_TREE, cv2.CHAIN_APPROX_NONE). External contours (those with child contours and no parent contours) are ignored to reduce noise.
Before running the project, connect the arm and a usb webcam to a computer with ROS and the software for the Interbotix arm installed (this project will not work in the vnc).
Launch the arm: roslaunch interbotix_xsarm_control xsarm_control.launch robot_model:=px100 use_sim:=false
Follow these instructions if the keyboard you are using has not already been calibrated.
Position the usb camera in the center of the keyboard, facing directly down. The whole keyboard should be in frame. Ideally the keyboard will have minimal glare and it will be on a matte, uniform surface. The width of the image must be known, in meters. Alternatively, an image of the keyboard can be uploaded, cropped exactly to known dimensions (i.e. the dimensions of the keyboard).
Run roslaunch typinator image_setup.launch to calibrate the image filters for optimized key detection. A variety of preset filters will be applied to the image. Apply different combinations of the following parameters and determin which filter preset/parameter combination is the best. An optimal filter will show keys with large boxes around them, not have a lot of noise, and most importantly detect all of the keys. If there is a lot of noise, calibration will take a long time.
Once the tranformation preset, reduce_glare, blur, and kernel have been selected, the arm can be calibrated and run. Run roslaunch typinator typinator.launch with the appropriate parameters:
The arm will press each key it detects and save its position! It will then type the output from ChatGPT! You can open a file you want it to type into, even while calibrating.
Running from a preset
If a specific keyboard has already been calibrated, position the arm appropriately and run roslaunch typinator typinator.launch calibrate:=False keyboard_preset:="filename.json" Also set image_file if you want boxes to display current keys, and chatgpt if you want a custom input to chatgpt.
indiv_keys(): This is the callback function of Key service. It processes the text that it’s passed as its goal, and separates it by key/letter so that only one will be typed at a time. It also takes into account capital letters and inserts ‘caps_lock’ before and after the letter is added to the result list, since a keyboard only types in lower case. Furthermore, it takes into account new lines and passes ‘Key.enter’ in place of logging ‘\n’.
This class subscribes to the 'generated_text' topic, which consists of the text generated by ChatGPT that the arm is meant to type. cb_to_action_server(): This is the function that sends/sets the goal for the action server, and waits for the action to completely finish before sending the result. It makes the ChatGPT message the goal of the action, and waits for the text/letter separation to complete before sending the list of individual letters of the the text as the result. get_next_key(): This function returns the first key in the deque, which is the letter that needs to be typed by the arm next.
This class is used to convert key pixel positions to arm target x,y coordinates from an image of a keyboard. img_cb() and img_cb_saved(): These functions use cv2 image processing to find the individual keys on a keyboard from an image. It sets some of the class variables, such as height and width, which is then later used to calculate the conversion rates used to turn the key pixel positions into meter positions. The img_cb() function is used when it's subscribing to, and processing images from, a camera topic. Then, the img_cb_saved() function is used when an already saved image of a keyboard is being used instead of one received from the camera. Both functions essentially have/use the same code. find_key_points(): This function converts key pixel locations in the image to the physical x,y meter positions that can then be used to move the real arm so that it can hit the keys as accurately as possible on the actual keyboard. print_points(): This function prints each calculated point that has been stored in the class. The points are where we need the robot arm to move to in order to press a key. practice_points(): This function returns the entire list of points saved in the class, with the x and y meter values of the keys' positions on the physical keyboard. key_pos_action and action_response(): This is the KeyPos action and its callback function. The purpose of the action is to send the physical positions of the each key. It send real x, y, and z coordinates along with image x, image y, image height, and image width coordinates.
This node connects to ChatGPT through an API key to generate a message/string for the arm to type onto the keyboard. It then publishes the text to the 'generated_text' topic to be used by other nodes.
This file contains the sever for the 'arm_control' action, and it connects to the robotic arm. The MoveArm class acts as the link between the coordinates that the server receives and the motion of the arm.
calculate_distance() converts cartesian coordinates to polar coordinates.
set_xy_position(x, y) moves the arm to the specified cartensian x,y coordinates over the keyboard
press_point(z) moves the arm down to and back up from the specified depth coordinate
This file connects the other ROS nodes together. It runs the "coordinator" node. In "calibrate" mode, the main() uses the Coordinator class to get the image of the keyboard and find the positions of individual keys. Since these keys are not laballed, it then has the arm press each found contour. After each press, it gets the last pressed key with coordinator.get_key_press(). This uses the KeyPress action to get the stored last key press. If a new key was pressed, it is mapped to the location that the arm went to. After the arm has gone to every found position, it saves the key to position mappings in a .json file.
In "type" mode, the main() function loads one of the stored key mappings into a python dictionary. It gets the next letter to type one at a time using the get_next_key() method of a KeysActionClient. It uses the dictionary to find the location of the key, and then it send the arm to that location.
This file contains the FindKeys class. This class is used to find the positions of keyboard keys.
transform_image(img, threshold, blur, dilate) applies a transformation to an image of a keyboard with the specified threshold, blur kernel, and dilation kernel.
contour_image(img) applies image contouring and noise reduction to find the keys. It returns the contours as instances of the Key class.
This file contains the Key class that stores the data of each individual key found from the FindKeys class. center() returns the center of a key.
This file listens for keyboard input with pynput. The KeyListener class keeps track of the most recent key release and acts as the server for the KeyPress action. When called, it returns the most recent key that was pressed.
We started the project with high hopes for the capabilities of the arm and image recognition software. We planned to have the arm hold a pen and press keys on the keyboard. We hoped that the keys would be recognized through letter detection with machine learning.
Initially, we mainly set up the Interbotix arm software in our vnc’s, tested the movement of the arm, and began working on keyboard recognition. Our preliminary tests with detecting the keys on the keyboard were promising. Letter detection for the letter keys was promising, however, it was not working for the special keys or keys with more than one symbol on them.
We decided that to get the main functionality of the project working, we would divide the work between ourselves.
Kirsten worked on connecting to ChatGPT, publishing the response from ChatGPT as characters on the keyboard, and transforming pixel coordinates in an image into real world coordinates in meters. We discovered that ROS nodes that perform actions will block for too long to receive improperly timed callbacks, so in order to avoid issues with this, Kirsten worked on converting letter publishing ROS topics into ROS actions. By designing our code this way, we were able to have a central ROS node that called ROS actions and got responses sequentially.
Elliot worked on moving the robotic arm so that it could move to specific cartesian coordinates and then press down. He also worked on refining the keyboard recognition and designing the central node to bring the project together. After many attempts at reducing noise with statistical methods when finding the outlines of keys on a keyboard (with OpenCV contouring), he discovered that the contour hierarchy was a much more effective way of reducing noise. With contour hierarchy and number of customizable image transformations applied to the images, he was able to consistently find the keys on keyboards.
After reexamining letter detection with machine learning, we decided that it was not consistent enough to work for the desired outcome of our project. We realized we could “calibrate” the arm on the keyboard by pressing each key that was found through OpenCV contouring and listening for keystrokes. In theory, this could provide 100% accuracy.
We encountered many difficulties when putting our pieces of the project together and running it on the real arm. As can be expected, a few small quirks with ROS and a few small bugs caused us a lot of difficulty. For example, when we first ran the project as a whole, it started but nothing happened. We eventually found that our text publishing node had a global variable declared in the wrong place and was returning None instead of the letters it received from ChatGPT.
One major issue we encountered is that the arm motor turns itself off any time it thinks it is in one position but is actually in a different position. This usually only happened after around 10 key presses, so to fix it we have the arm return to its sleep position every 6 keystrokes. Another major issue is that the arm holds down on the keys for too long. We solved this problem by turning off key repeats in the accessibility settings of the computer controlling the arm. We found that the arm has some limitations with its accuracy which affects its typing accuracy, since the keys are such small targets. It also does not seem to accurately go to specific positions. It always goes to the same positions at a given angle, but its extension and retraction varies based on its current position. It was challenging, but we were able to find a function of the angle of the arm that offsets this error fairly accurately for angles less than 45 degrees, which is what we needed. If we were starting from scratch, we would place a fiducial on the arm and track its motion to try to get better accuracy.
We were mostly successful in achieving our original project goals. We are able to recognize a keyboard, train the arm on that keyborad, and type an output from ChatGPT. We were not successful in using letter recognition to press found keys in real time, however, with our method of calibrating the arm on a specific keyboard, the arm was able press any key on almost any keyboard. If we manually input arm positions for each key on a specific keyboard we would likely get better typing accuracy, but this would not be in line with our initial goal. Our use of image contouring to find keys and transformations to convert pixels to real coordinates makes the project applicable to any keybaord without manual input.
For our team's COSI119a Autonomous Robotics Term Project, we wanted to tackle a challenge that was not too easy or not hard. All of our members have only recently learned ROS, so to create a fully demo-able project in 8 weeks sounded impossible. We started off having a few ideas: walking robot that follows an owner, robot that plays tag, and a pet robot that accompanies one. There were a lot of blockers for those ideas from limitation of what we know, tech equipments, time constraints, and mentor's concern that it will not be able to. We had to address issues like:
In the end, we decided to work on a robot that guards an object and stop an intruder from invading a specified region. We pivoted from having one robot to having multiple robots so that they are boxing out the object that we are protecting. We tested a lot of design decisions where we wanted to see which method would give us the desired result with the most simple, least error prone, and high perfomring result.
There were a lot of learnings throughout this project, and while even during the last days we were working to deploy code and continue to test as there is so much that we want to add.
Video demo: https://drive.google.com/drive/folders/1FiVtw_fQFKpZq-bJSLRGotYXPQ-ROGjI?usp=sharing
As we will be approaching this project with an agile scrum methodology, we decided to take the time in developing our user stories, so that at the end of the week during our sprint review we know if we are keeping us on track with our project. After taking a review of the assignment due dates for other assignments of the class, we thought that having our own group based deadlines on Friday allows us to make these assignments achievable on time. Below is a brief outline of our weekly goals.
Here is a ⏰ timeline ⏳ , we thought were were going to be able to follow:
March 3: Finish the Movie Script That Explains Story of Waht we want to do and Proposal Submission
March 10: Figure out if tf can be done in gazebo
March 17: Run multiple real robots
Here is a timeline of what we actually did:
March 3: Finished all Drafting and Proposal - Submitted to get Feedback and Confirmation That it is Good To Go (Karen, LiuLu, Rongzi)
March 10: Figure out if tf can be done in gazebo (Rongzi), Creating Github Repo (Karen), Drawing Diagrams (Liulu), Explore Gazebo Worlds - Get Assests and Understand Structure (Karen)
March 17: Run multiple real robots on Gazebo (Karen), Created multi robot gazebo launch files (Karen), Wrote Code on Patroling Line (Liulu), Create box world (Rongzi), Make Behavior Diagram (Karen)
Here is another breakdown of the timeline that we actually followed:
To address blockers, we had to start asking ourselves questions and addressing issues like:
What are the major risky parts of your idea so you can test those out first?
What robot(s) will you want to use?
What props (blocks, walls, lights) will it need?
Here was the original plan of what we wanted to display:
Though things do not often go to plan as we did not realize that step 2 to step 3 was going to be so much harder as there was all these edge cases and blockers that we discovered (concurrency, network latency, camera specs). We ended up really only focusing on the patrolling and block stages.
There are many states to our project. There is even states withhin states that need to be broken down. Whenever we were off to coding, we had to make sure that we were going back to this table to check off all the marks about control of logic. We were more interested in getting all the states working, and so we did not use any of the packages of state management. Another reason why we did not proceed with using those state pacakges was because we needed to have multiple files as one python file represented one node so we were not able to be running multiple robot through one file.
Here are the states that we were planning to have.
Finding State: Trigger: Lidar detection/Fiducial Detection/Opencv: Recognizing the target object, consider sticking a fiducial to the target object, and that will help the robot find the target object. The state is entered when Lidar finds nothing but the target object with a fiducial.
Patrolling State: Trigger: Lidar detection: When there is nothing detected in the right and left side of the robot, the robot will keep patrolling and receive callbacks from the subscriber.
Signal State: Trigger: Lidar detection: Finding intruders, which means the lidar detect something around and will recognize it as the intruder New topic: If_intruder: Contain an array that formed by four boolean values corresponds to each robot’s publisher of this topic or the position of another robot. The robot will publish to a specific index of this array with the boolean value of the result of their lidar detection. If there is nothing, the robot will send False, and if it can get into the Signal State, it will send it’s position and wait for the other robot’s reaction.
Form Line State: Trigger: The message from topic if_intruder: When a robot receives a position message, it will start to go in that direction by recognizing the index of the position message in the array, and they’ll go to that corresponding colored line. Behavior Tree: A behavior will be created that can help the robot realign in a colored line.
Blocking State: Trigger: tf transformation:All the robots have the information that there is an intruder. All the robot will go to the direction where the intruder is and realign and try to block the intruder
Notify State: Trigger: Lidar Detection: If the lidar keeps detecting the intruder and the intruder doesn’t want to leave for a long time, the robot will keep blocking the intruder without leaving. If the intruder leaves at some time, the robot will get back to the blocking state and use lidar to detect and make sure there is no intruder here and turn back to the finding state
In the end, these were the only states that we actually tackled:
Get correct color for line following in the lab Line follower may work well and easy to be done in gazebo because the color is preset and you don't need to consider real life effect. However, if you ever try this in the lab, you'll find that many factors will influence the result of your color.
Real Life Influencer:
Light: the color of the tage can reflect in different angles and rate at different time of a day depend on the weather condition at that day.
Shadow: The shadow on the tape can cause error of color recognization
type of the tape: The paper tage is very unstable for line following, the color of such tape will not be recognized correctly. The duct tape can solve most problem since the color that be recognized by the camera will not be influenced much by the light and weather that day. Also it is tougher and easy to clean compare to other tape.
OpenCV and HSV color: Opencv use hsv to recognize color, but it use different scale than normal. Here is a comparison of scale: normal use H: 0-360, S: 0-100, V: 0-100 Opencv use H: 0-179, S: 0-255, V: 0-255
So if we use color pick we find online, we may need to rescale it to opencv's scale.
Here is a chart that talks about how we run the real robots live with those commands. On the right most column that is where we have all of the colors for each line that the robot home base should be:
If you are interested in launching on the real turtlebot3, you are going to have to ssh into it and then once you have that ssh then you will be able to all bringup on it. There is more detail about this in other FAQs that can be searched up. When you are running multirobots, be aware that it can be a quite bit slow because of concurrency issues.
These 3 files are needed to run multiple robots on Gazebo. In the object.launch that is what you will be running roslaunch. Within the robots you need to spawn multiple one_robot and give the position and naming of it.
Within the object.launch of line 5, it spawns an empty world. Then when you have launched it you want to throw in the guard_world which is the one with the multiple different colors and an object to project in the middle. Then you want to include the file of robots.launch because that is going to be spawning the robots.
For each robot, tell it to spawn. We need to say that it takes in a robot name and the init_pose. And then we would specify what node that it uses.
Within the robots.launch, we are going to have it spawn with specified position and name.
Basic Idea:
Guard object has a Twist() which will control the velocity of the robot. It also has a subscriber that subscribe to scan topic to receive LaserScan message and process the message in scan_cb() which is the callback function of the scan topic. The ranges field of the LaserScan message gives us an array with 360 elements each indicating the distance from the robot to obstacle at that specific angle. The callback function takes the ranges field of the LaserScan message, split into seven regions unevenly as shown below:
The minimum data of each region is stored in a dictionary. Then change_state function is called inside the scan_cb, which will check the region dictionary and update the intruder state as needed.
Work with real robot:
Dealing with signal noise
The laser scan on real robot is not always stable. Noisy data is highly likely to occur which can influence our intruder detection a lot. To avoid the influence of scan noise, we processed the raw ranges data to get a new ranges list which each element is the average of itself and 4 nearby elements in original ranges data. This data smoothing step can help us get a more reliable sensor data.
Sensor on real robot
The sensor of each robot is build differently. In gazebo, if nothing is scanned at that angle, inf is shown for the corresponding element in the ranges. However, some real-life robot have different LaserScan data. Nothing detected within the scan range will give a 0 in ranges data. To make our code work correctly on both Gazebo and real robot, please follow our comment in the code. There are only two lines of code that need to be changed.
Also, the laserScan data for Rafael has different number of elements. So the region division based on index is a little different for Rafael. We have different Python file for each robot, so this part is taken care of in line_F4.py which is only for Rafael.
A new message is created for our robots to communicate about intruder detection. The message contains four boolean values each associated with one of our guardbot. When a guardbot detects the intruder, a new message will be created with that associated boolean value set to True, and the new message will be published to a topic called see_intruder. Each robot also has a subscriber that subscribes to this topic and a callback function that will check the passed-in message and get the information about which robot is seeing the intruder.
The CMakeLists.txt and package.xml are also modified to recognize this newly created message.
We had to watch a lot of videos to figure out how to do this. We made an msg file which stored the type of data that we will hold which are boolean values on if the robot sees an intruder. We had to edit the cmake file and then had to edit the xml because we need to say that there is this new created message that the robots may communicate with and then have these structure look through the folder to see how it is created.
We need our own messades and tonics for the rohots to communicate. Here are the new messages:
see intruder: the message contains four std msgs/Boolean, each associated with a specific robot. When an intruder is detected by one robot. its' associated Boolean will be set to True. Only one robot can be true.
stop order: the message contains a list of std_msgs/String which would record the name of the robots in the stop order, and an std msas/Int8 which would record the current index of the list for the next stop or move.
Here is a chart talking about what we are interested in:
Here are the links that we used quite a lot: https://wiki.ros.org/ROS/Tutorials/CreatingMsgAndSrv https://www.theconstructsim.com/solve-error-importerror-no-module-named-xxxx-msg-2/
This project does not end here, there is a lot more that we can add. For an example here are a couple of other features that cam be added:
Having more sides so that there is faster converage
Making it run faster and still be as accurate with its patrolling
Finding a better system so that it does not need the order ahead of time if possible
We feel like as a team we suceeded a lot in this project. We had great communication and determination that makes us such good teammates. We did not know each other before doing this project and at the beginning of the week we were a bit hesitant. We
👩💻👩💻👩💻👩💻👩💻👩💻👩💻👩💻👩💻👩💻👩💻👩💻👩💻👩💻👩💻👩💻👩💻👩💻👩💻👩💻👩💻👩💻👩💻👩💻👩💻👩💻👩💻👩💻👩💻👩💻👩💻👩💻👩💻👩💻👩💻👩💻👩💻👩💻👩💻👩💻👩💻👩💻👩💻👩💻
**Fig 1. Traffic light examples****Fig 2a. Initial turn sign examples****Fig 2b. Revised turn sign examples****Milestone-1:** Be able to detect and recognize the signs in digital formats (i.e. jpg or png) downloaded online. No ROS work needs to be done at this stage.
**Milestone-2:** Complete all the fundamental functionalities, and be able to achieve what’s described in a simulation environment.
**Milestone-3:** Be able to carry out the tasks on a real robot in a clean environment that’s free of noises from other objects. We will use blocks to build the routes so that laser data can be used to make turns. We will print out images of traffic signs on A4 white paper and stick them onto the blocks.n==4 → patrol(A, B, C, D)
robotB dies
leader interrupts robotD
leader assigns robotD to zone B
n==3 → patrol(A, B, C)
publishes vote request messages to all the other mp nodes in parallel.
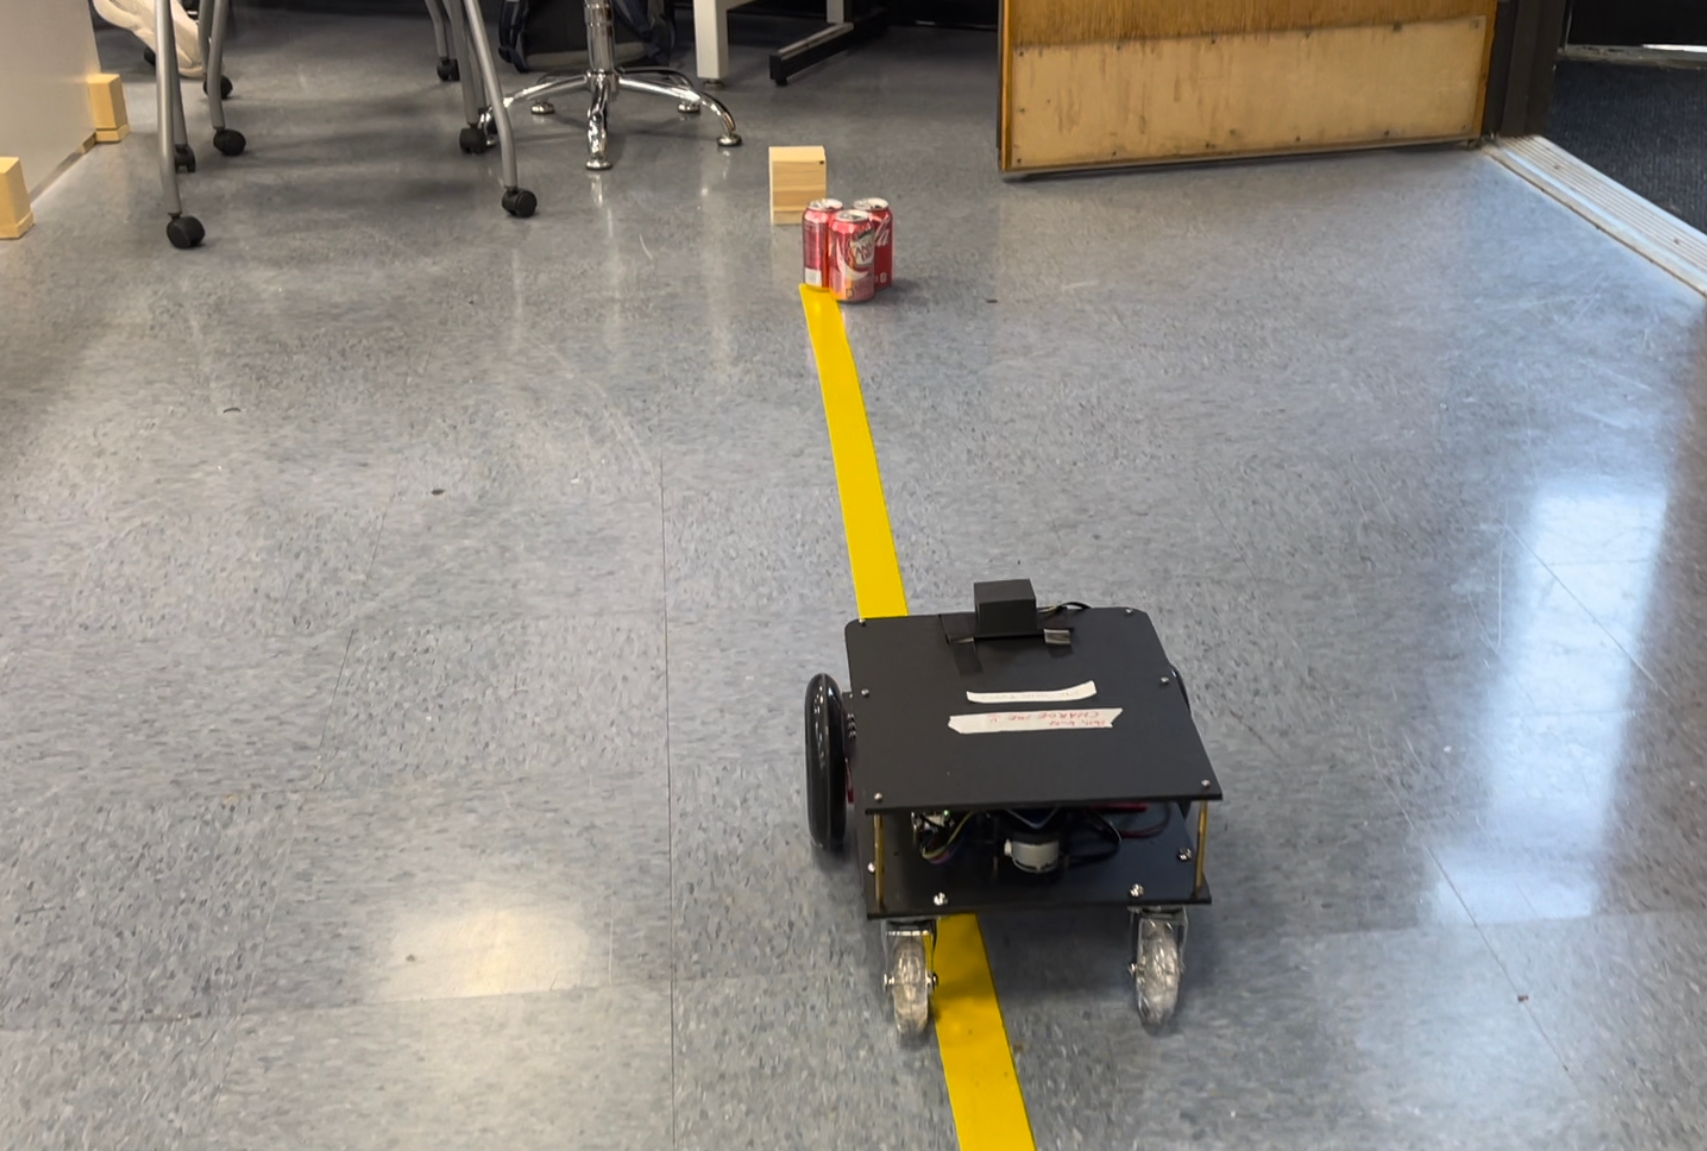
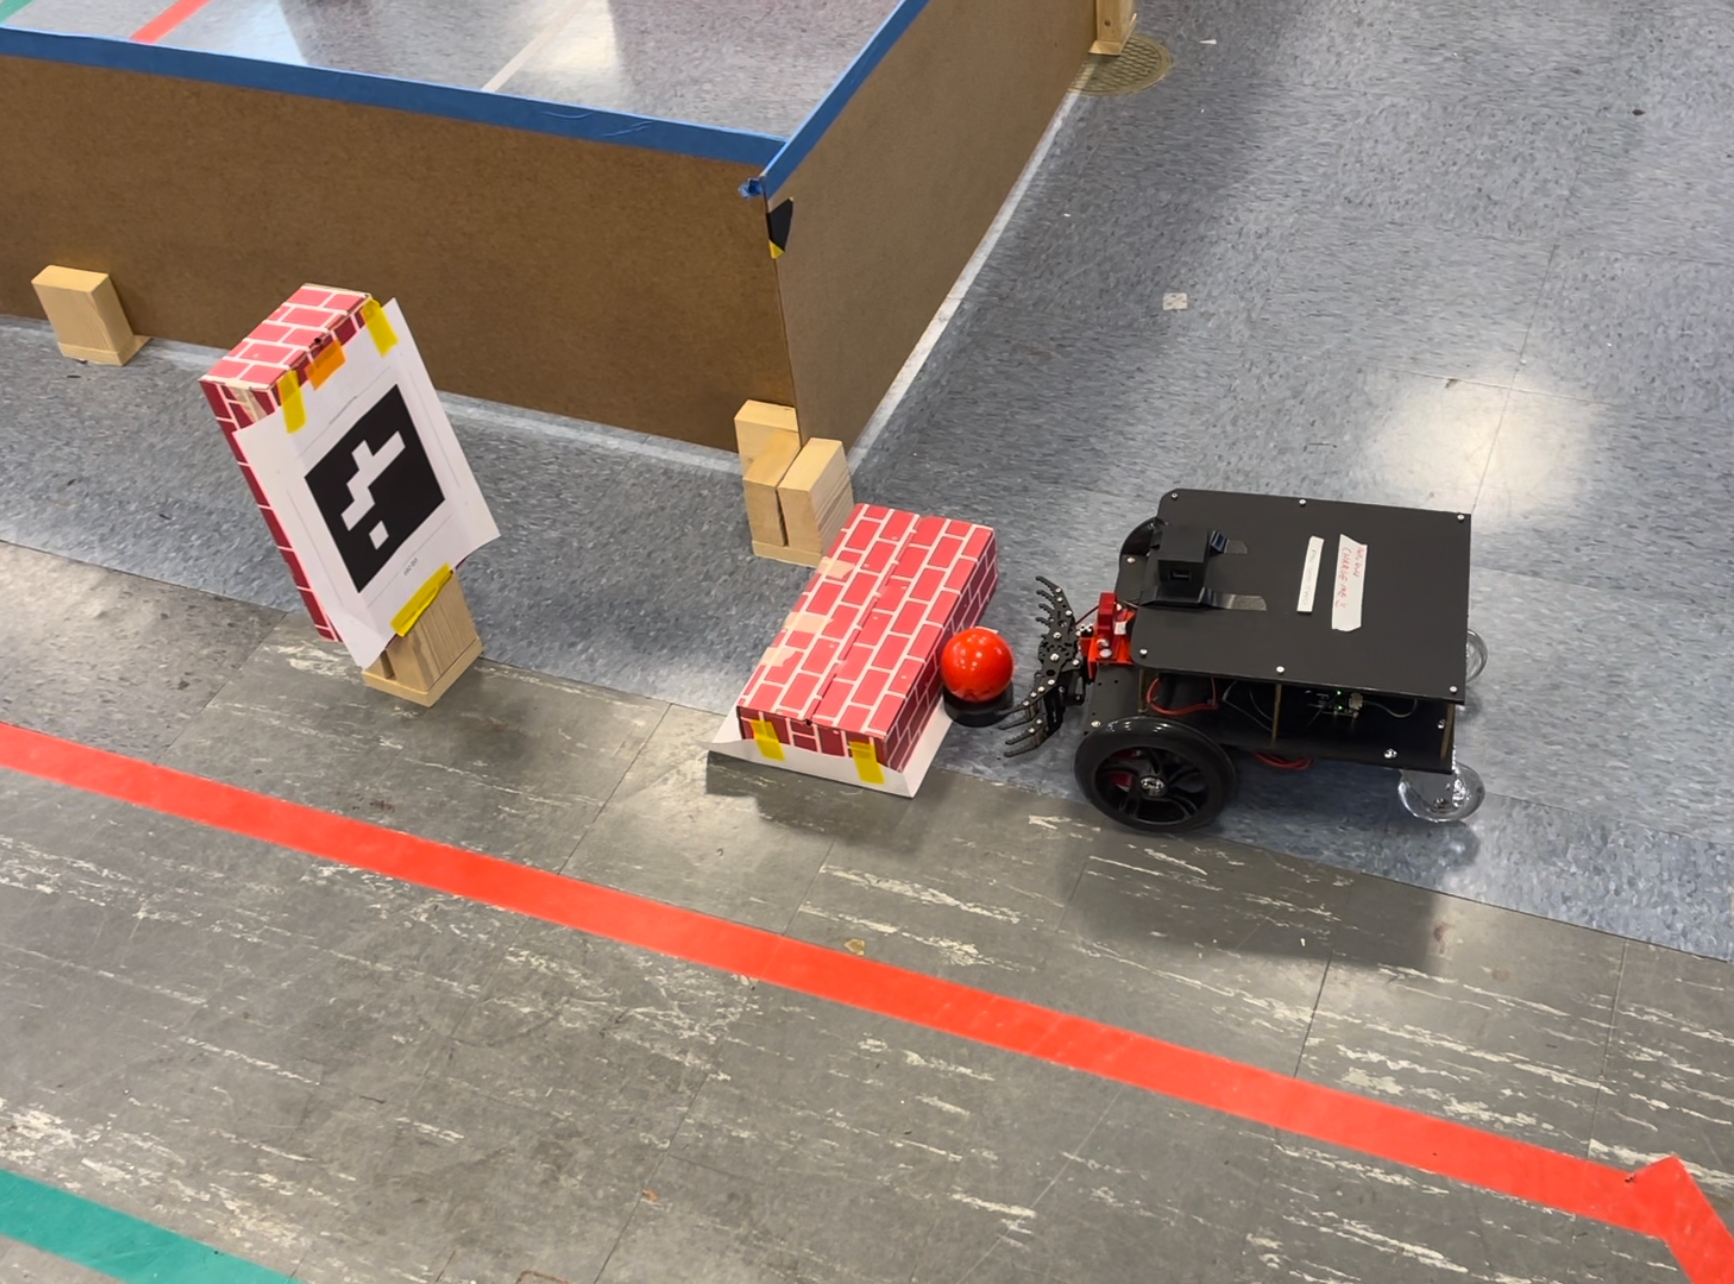
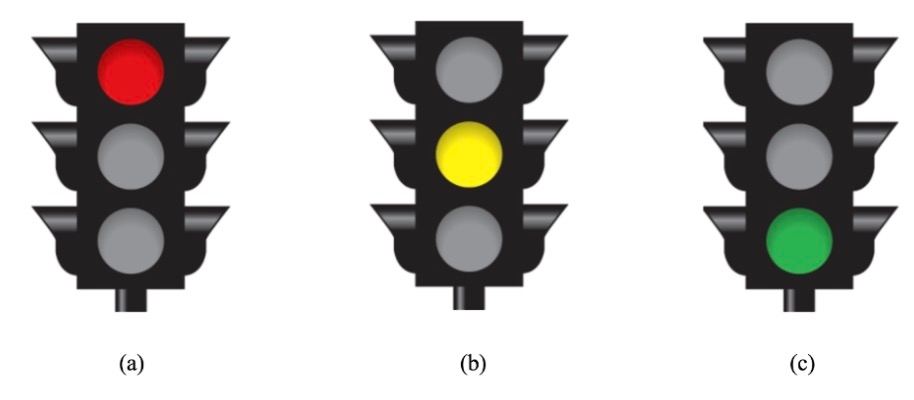
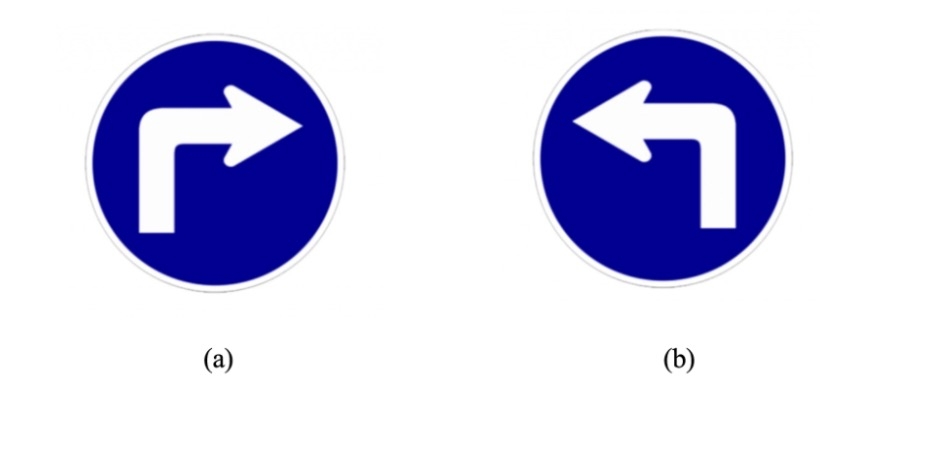
Send and receive data from ChatGPT
Computer Vision
Recognize keys on a keyboard
Detect letters on a keyboard (this was not used in the final project due to inconsistency)
Transform image coordinates to real world coordinates
Arm Control
Move the arm to specific positions with high accuracy
1
Apply a dilation kernel to the image. 1 has no effect (1 pixel kernel)
0
MUST SET THIS VALUE DURING CALIBRATION: Set to the the real world width of the image in meters
img_height
img_width*aspect ratio
Set this to the real world height of the image if necessary
arm_offset
0
Set this to the distance from the bottom edge of the image to the middle of the base of the arm
image_file
False
Input the path to the image file you would like to use if not using the camera
reduce_glare
False
Set to True to apply glare-reduction to the image
blur
1
Apply blur to the image before finding contours. 1 results in no blur.
kernel
1
Apply a dilation kernel to the image. 1 has no effect (1 pixel kernel)
thresh_preset
1
Apply this threshold preset to the image.
move_then_press(x,y,z) calls set_xy_position(x,y) followed by pres_point(z)
move_arm(msg) is an action callback function that calls for an instance of the MoveArm class to move the arm to the specified coordinates. It returns "True" when done.
key_pub.py
key_pos_action
key_pos.py
Keys
string full_text --- string[] keys --- bool status
image_file
False
Input the path to the image file you would like to use if not using the camera
reduce_glare
False
Set to True to apply glare-reduction to the image
blur
1
Apply blur to the image before finding contours. 1 results in no blur.
calibrate
True
Set to false if loading the keyboard from a preset
keyboard_preset
"temp_preset.json"
In calibration mode, save the keyboard to this file. Load this keyboard file if calibrate=False.
chatgpt
"Generate random text, but not lorem ipsum"
Text input to chatgpt
coordinator
coordinator.py
arm_control
arm_control.py
keys_to_type_action_client
keys_to_type_client.py
keys_to_type_action_server
keys_to_type_server.py
chatgpt_connection
chat_gpt.py
arm_control
ArmControl
float32 x float32 y float32 z --- string success --- string status
key_pos_action
KeyPos
string mode --- float32[] positions int32[] img_positions --- bool status
key_press
KeyPress
string mode bool print --- string key --- bool status
/generated_text
String
kernel
img_width
key_pub
keys_to_type_action
March 31: Aligning to be protecting it - circle or square like formation
April 7: Detecting if something is coming at it
April 14: Making the robot move to protect at the direction that the person is coming at it from
April 21: Testing
April 28: Testing
May 3: Stop writing code and work on creating a poster
May 10 Continuing to prepare for the presentation
March 24: Continue to write code on patroling the line for multirobot (Liulu), Explored fiducials to integrate (Karen), Made better Gazebo world (Rongzi)
March 31: Aligning to be protecting it - circle or square like formation
April 7: Detecting if something is coming at it
April 14: Making the robot move to protect at the direction that the person is coming at it from
April 21: Testing
April 28: Testing
May 3: Stop writing code and work on creating a poster
May 10 Continuing to prepare for the presentation
And many other questions.
color in other object: In the real life, there are not only the lines you put on the floor but also other objects. Sometimes robots will love the color on the floor since it is kind of a bright white color and is easy to be included in the range. The size of range of color is a trade off. If the range is too small, then the color recognization will not be that stable, but if it is too big, robot will recognize other color too. if you are running multiple robots, it might be a good idea to use electric tape to cover the red wire in the battery and robot to avoid recognizing robot as red line.
Adding extra technologies where robots are connecting to like an Alexa can tell them to stop
Add a way to have it be stopped by human input and have it overrided


